Ghanaian vs Tohono O'odham Median Family Income
COMPARE
Ghanaian
Tohono O'odham
Median Family Income
Median Family Income Comparison
Ghanaians
Tohono O'odham
$98,877
MEDIAN FAMILY INCOME
12.6/ 100
METRIC RATING
204th/ 347
METRIC RANK
$72,193
MEDIAN FAMILY INCOME
0.0/ 100
METRIC RATING
344th/ 347
METRIC RANK
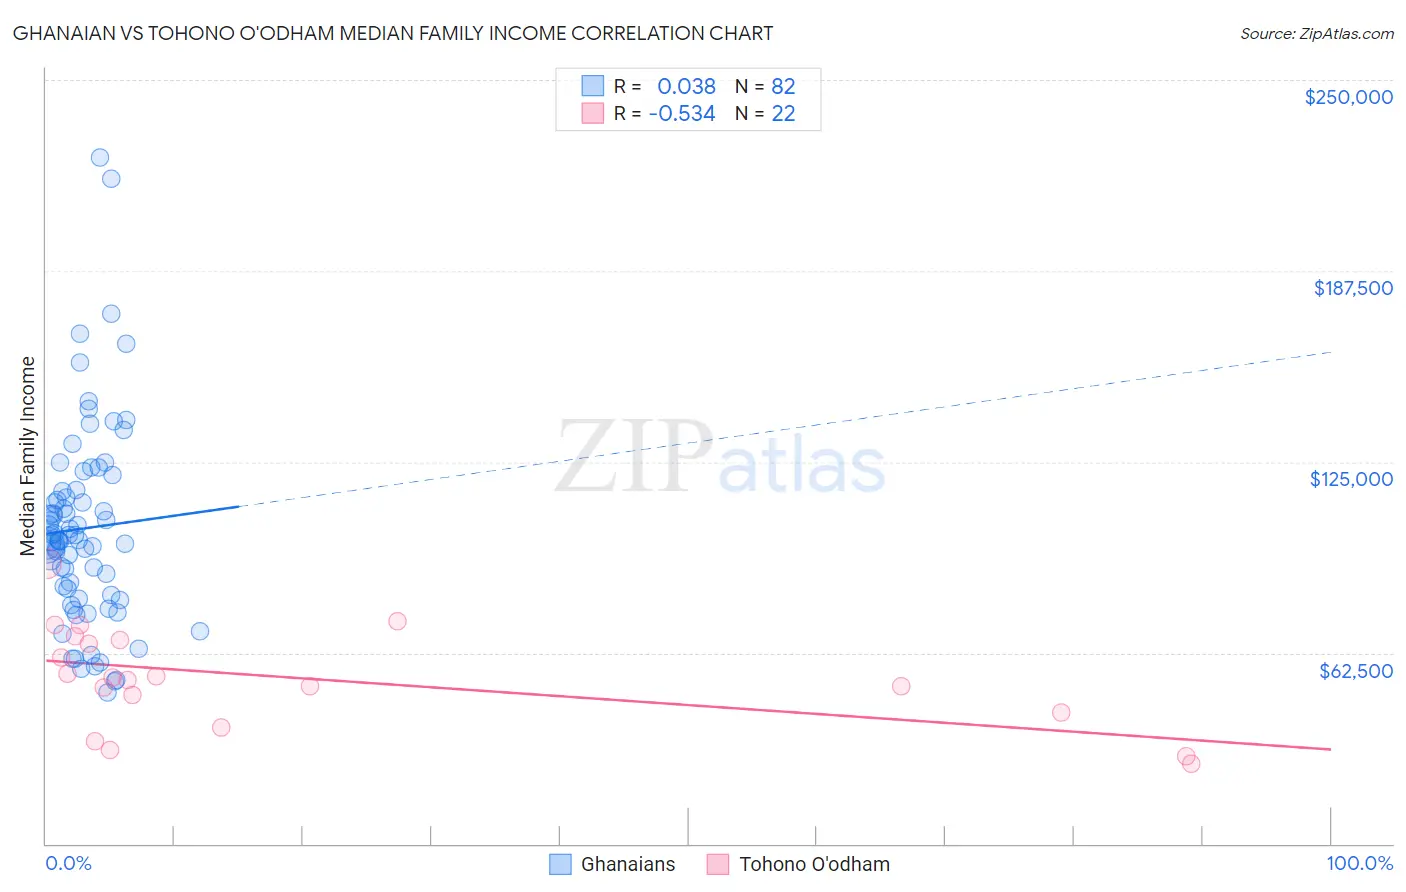
Ghanaian vs Tohono O'odham Median Family Income Correlation Chart
The statistical analysis conducted on geographies consisting of 190,476,468 people shows no correlation between the proportion of Ghanaians and median family income in the United States with a correlation coefficient (R) of 0.038 and weighted average of $98,877. Similarly, the statistical analysis conducted on geographies consisting of 58,714,192 people shows a substantial negative correlation between the proportion of Tohono O'odham and median family income in the United States with a correlation coefficient (R) of -0.534 and weighted average of $72,193, a difference of 37.0%.
Median Family Income Correlation Summary
| Measurement | Ghanaian | Tohono O'odham |
| Minimum | $49,625 | $26,100 |
| Maximum | $224,545 | $91,728 |
| Range | $174,920 | $65,628 |
| Mean | $103,158 | $54,111 |
| Median | $99,461 | $53,986 |
| Interquartile 25% (IQ1) | $81,320 | $43,011 |
| Interquartile 75% (IQ3) | $115,481 | $66,792 |
| Interquartile Range (IQR) | $34,161 | $23,781 |
| Standard Deviation (Sample) | $32,730 | $16,520 |
| Standard Deviation (Population) | $32,529 | $16,140 |
Similar Demographics by Median Family Income
Demographics Similar to Ghanaians by Median Family Income
In terms of median family income, the demographic groups most similar to Ghanaians are Hawaiian ($98,869, a difference of 0.010%), Immigrants from Iraq ($98,786, a difference of 0.090%), Aleut ($98,702, a difference of 0.18%), Immigrants from Uruguay ($98,205, a difference of 0.68%), and Scotch-Irish ($99,591, a difference of 0.72%).
| Demographics | Rating | Rank | Median Family Income |
| Immigrants | Cameroon | 22.8 /100 | #197 | Fair $100,289 |
| Immigrants | Africa | 22.5 /100 | #198 | Fair $100,256 |
| Yugoslavians | 21.3 /100 | #199 | Fair $100,119 |
| Spanish | 20.1 /100 | #200 | Fair $99,977 |
| Immigrants | Thailand | 19.0 /100 | #201 | Poor $99,840 |
| Whites/Caucasians | 18.7 /100 | #202 | Poor $99,800 |
| Scotch-Irish | 17.1 /100 | #203 | Poor $99,591 |
| Ghanaians | 12.6 /100 | #204 | Poor $98,877 |
| Hawaiians | 12.5 /100 | #205 | Poor $98,869 |
| Immigrants | Iraq | 12.1 /100 | #206 | Poor $98,786 |
| Aleuts | 11.6 /100 | #207 | Poor $98,702 |
| Immigrants | Uruguay | 9.2 /100 | #208 | Tragic $98,205 |
| Immigrants | Colombia | 8.7 /100 | #209 | Tragic $98,067 |
| Puget Sound Salish | 8.2 /100 | #210 | Tragic $97,958 |
| Immigrants | Sudan | 7.4 /100 | #211 | Tragic $97,737 |
Demographics Similar to Tohono O'odham by Median Family Income
In terms of median family income, the demographic groups most similar to Tohono O'odham are Navajo ($70,989, a difference of 1.7%), Puerto Rican ($70,423, a difference of 2.5%), Lumbee ($68,679, a difference of 5.1%), Houma ($76,188, a difference of 5.5%), and Crow ($76,605, a difference of 6.1%).
| Demographics | Rating | Rank | Median Family Income |
| Kiowa | 0.0 /100 | #333 | Tragic $80,885 |
| Menominee | 0.0 /100 | #334 | Tragic $79,563 |
| Yup'ik | 0.0 /100 | #335 | Tragic $79,290 |
| Immigrants | Cuba | 0.0 /100 | #336 | Tragic $78,249 |
| Yuman | 0.0 /100 | #337 | Tragic $78,055 |
| Immigrants | Yemen | 0.0 /100 | #338 | Tragic $77,457 |
| Pima | 0.0 /100 | #339 | Tragic $77,431 |
| Hopi | 0.0 /100 | #340 | Tragic $77,188 |
| Pueblo | 0.0 /100 | #341 | Tragic $76,880 |
| Crow | 0.0 /100 | #342 | Tragic $76,605 |
| Houma | 0.0 /100 | #343 | Tragic $76,188 |
| Tohono O'odham | 0.0 /100 | #344 | Tragic $72,193 |
| Navajo | 0.0 /100 | #345 | Tragic $70,989 |
| Puerto Ricans | 0.0 /100 | #346 | Tragic $70,423 |
| Lumbee | 0.0 /100 | #347 | Tragic $68,679 |