Ghanaian vs Norwegian Median Household Income
COMPARE
Ghanaian
Norwegian
Median Household Income
Median Household Income Comparison
Ghanaians
Norwegians
$83,582
MEDIAN HOUSEHOLD INCOME
27.4/ 100
METRIC RATING
194th/ 347
METRIC RANK
$86,084
MEDIAN HOUSEHOLD INCOME
65.3/ 100
METRIC RATING
165th/ 347
METRIC RANK
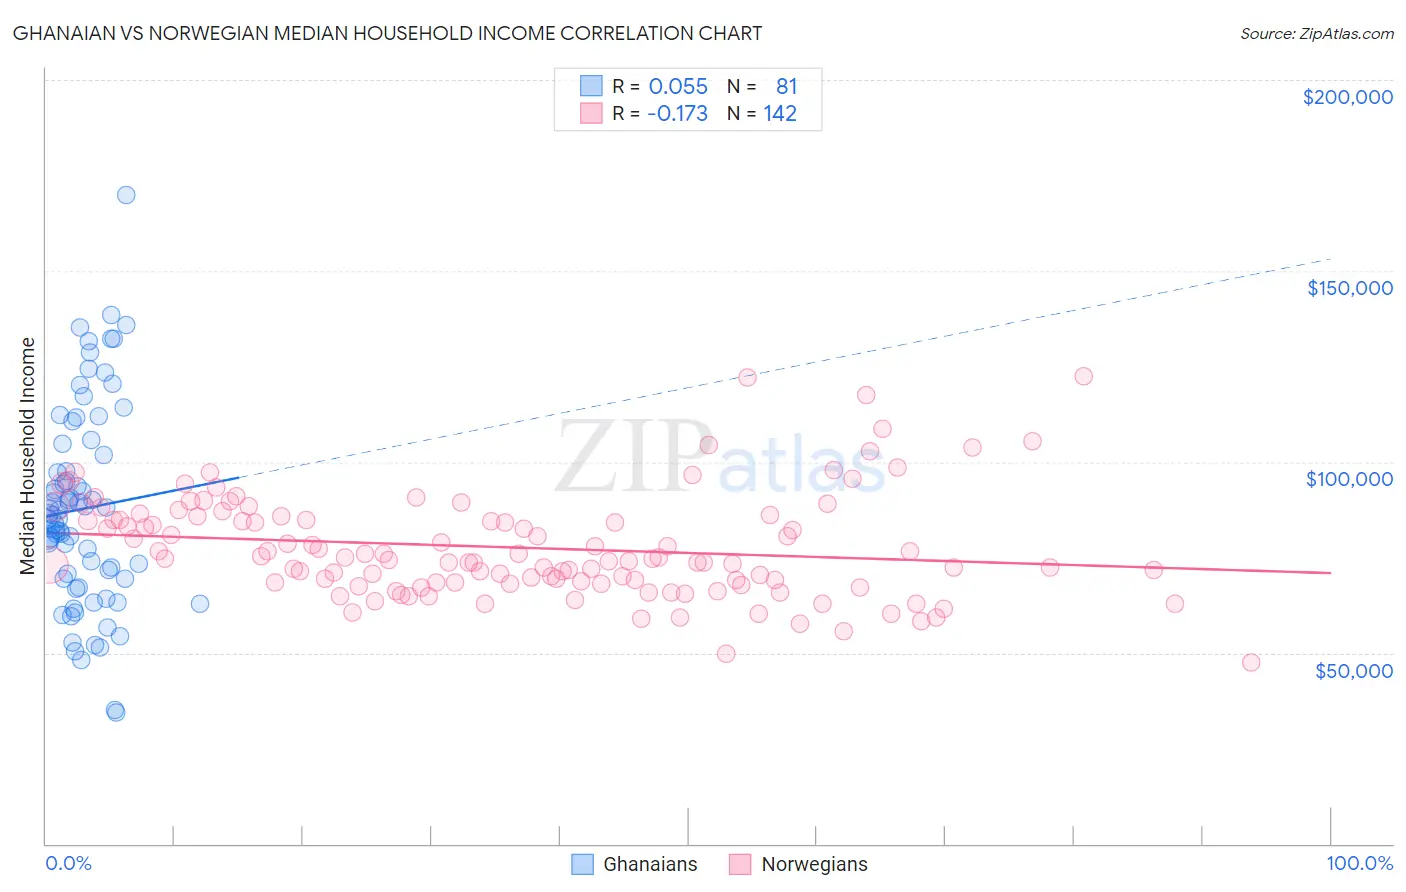
Ghanaian vs Norwegian Median Household Income Correlation Chart
The statistical analysis conducted on geographies consisting of 190,498,021 people shows a slight positive correlation between the proportion of Ghanaians and median household income in the United States with a correlation coefficient (R) of 0.055 and weighted average of $83,582. Similarly, the statistical analysis conducted on geographies consisting of 532,629,578 people shows a poor negative correlation between the proportion of Norwegians and median household income in the United States with a correlation coefficient (R) of -0.173 and weighted average of $86,084, a difference of 3.0%.
Median Household Income Correlation Summary
| Measurement | Ghanaian | Norwegian |
| Minimum | $34,375 | $47,500 |
| Maximum | $169,773 | $122,560 |
| Range | $135,398 | $75,060 |
| Mean | $87,698 | $77,577 |
| Median | $86,122 | $74,729 |
| Interquartile 25% (IQ1) | $69,414 | $68,461 |
| Interquartile 75% (IQ3) | $103,226 | $85,771 |
| Interquartile Range (IQR) | $33,812 | $17,310 |
| Standard Deviation (Sample) | $26,089 | $13,465 |
| Standard Deviation (Population) | $25,928 | $13,417 |
Similar Demographics by Median Household Income
Demographics Similar to Ghanaians by Median Household Income
In terms of median household income, the demographic groups most similar to Ghanaians are Finnish ($83,607, a difference of 0.030%), Immigrants from Armenia ($83,555, a difference of 0.030%), Welsh ($83,628, a difference of 0.060%), French ($83,468, a difference of 0.14%), and Aleut ($83,446, a difference of 0.16%).
| Demographics | Rating | Rank | Median Household Income |
| Belgians | 33.2 /100 | #187 | Fair $84,008 |
| Tlingit-Haida | 32.6 /100 | #188 | Fair $83,968 |
| Immigrants | Colombia | 31.7 /100 | #189 | Fair $83,902 |
| Slovaks | 30.2 /100 | #190 | Fair $83,798 |
| Iraqis | 29.6 /100 | #191 | Fair $83,753 |
| Welsh | 28.0 /100 | #192 | Fair $83,628 |
| Finns | 27.7 /100 | #193 | Fair $83,607 |
| Ghanaians | 27.4 /100 | #194 | Fair $83,582 |
| Immigrants | Armenia | 27.0 /100 | #195 | Fair $83,555 |
| French | 26.0 /100 | #196 | Fair $83,468 |
| Aleuts | 25.7 /100 | #197 | Fair $83,446 |
| Japanese | 25.1 /100 | #198 | Fair $83,395 |
| Germans | 24.6 /100 | #199 | Fair $83,358 |
| Tsimshian | 24.5 /100 | #200 | Fair $83,346 |
| Spanish | 24.4 /100 | #201 | Fair $83,343 |
Demographics Similar to Norwegians by Median Household Income
In terms of median household income, the demographic groups most similar to Norwegians are Scandinavian ($86,073, a difference of 0.010%), Irish ($86,145, a difference of 0.070%), Czech ($86,164, a difference of 0.090%), Guamanian/Chamorro ($86,255, a difference of 0.20%), and Immigrants ($85,818, a difference of 0.31%).
| Demographics | Rating | Rank | Median Household Income |
| Moroccans | 70.6 /100 | #158 | Good $86,468 |
| Immigrants | Uzbekistan | 70.1 /100 | #159 | Good $86,425 |
| Luxembourgers | 70.0 /100 | #160 | Good $86,418 |
| Slavs | 69.7 /100 | #161 | Good $86,398 |
| Guamanians/Chamorros | 67.7 /100 | #162 | Good $86,255 |
| Czechs | 66.4 /100 | #163 | Good $86,164 |
| Irish | 66.2 /100 | #164 | Good $86,145 |
| Norwegians | 65.3 /100 | #165 | Good $86,084 |
| Scandinavians | 65.1 /100 | #166 | Good $86,073 |
| Immigrants | Immigrants | 61.3 /100 | #167 | Good $85,818 |
| Icelanders | 61.0 /100 | #168 | Good $85,797 |
| Colombians | 59.7 /100 | #169 | Average $85,716 |
| Swiss | 59.2 /100 | #170 | Average $85,681 |
| Immigrants | South America | 58.1 /100 | #171 | Average $85,611 |
| Slovenes | 57.4 /100 | #172 | Average $85,562 |