Ghanaian vs Guatemalan Median Household Income
COMPARE
Ghanaian
Guatemalan
Median Household Income
Median Household Income Comparison
Ghanaians
Guatemalans
$83,582
MEDIAN HOUSEHOLD INCOME
27.4/ 100
METRIC RATING
194th/ 347
METRIC RANK
$75,961
MEDIAN HOUSEHOLD INCOME
0.3/ 100
METRIC RATING
264th/ 347
METRIC RANK
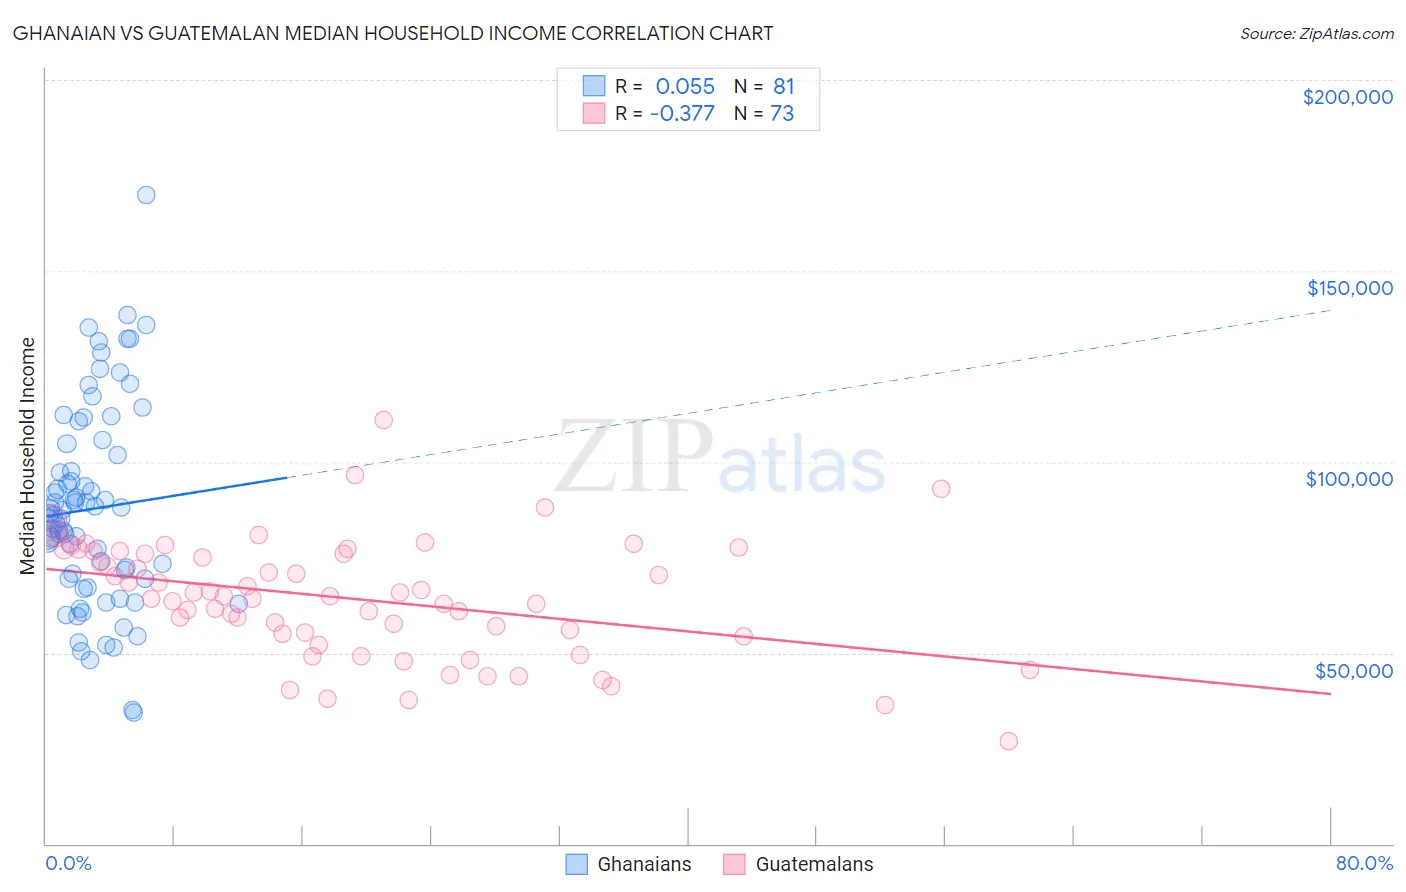
Ghanaian vs Guatemalan Median Household Income Correlation Chart
The statistical analysis conducted on geographies consisting of 190,498,021 people shows a slight positive correlation between the proportion of Ghanaians and median household income in the United States with a correlation coefficient (R) of 0.055 and weighted average of $83,582. Similarly, the statistical analysis conducted on geographies consisting of 409,198,651 people shows a mild negative correlation between the proportion of Guatemalans and median household income in the United States with a correlation coefficient (R) of -0.377 and weighted average of $75,961, a difference of 10.0%.
Median Household Income Correlation Summary
| Measurement | Ghanaian | Guatemalan |
| Minimum | $34,375 | $26,979 |
| Maximum | $169,773 | $111,004 |
| Range | $135,398 | $84,025 |
| Mean | $87,698 | $64,179 |
| Median | $86,122 | $64,652 |
| Interquartile 25% (IQ1) | $69,414 | $54,709 |
| Interquartile 75% (IQ3) | $103,226 | $76,221 |
| Interquartile Range (IQR) | $33,812 | $21,512 |
| Standard Deviation (Sample) | $26,089 | $15,411 |
| Standard Deviation (Population) | $25,928 | $15,305 |
Similar Demographics by Median Household Income
Demographics Similar to Ghanaians by Median Household Income
In terms of median household income, the demographic groups most similar to Ghanaians are Finnish ($83,607, a difference of 0.030%), Immigrants from Armenia ($83,555, a difference of 0.030%), Welsh ($83,628, a difference of 0.060%), French ($83,468, a difference of 0.14%), and Aleut ($83,446, a difference of 0.16%).
| Demographics | Rating | Rank | Median Household Income |
| Belgians | 33.2 /100 | #187 | Fair $84,008 |
| Tlingit-Haida | 32.6 /100 | #188 | Fair $83,968 |
| Immigrants | Colombia | 31.7 /100 | #189 | Fair $83,902 |
| Slovaks | 30.2 /100 | #190 | Fair $83,798 |
| Iraqis | 29.6 /100 | #191 | Fair $83,753 |
| Welsh | 28.0 /100 | #192 | Fair $83,628 |
| Finns | 27.7 /100 | #193 | Fair $83,607 |
| Ghanaians | 27.4 /100 | #194 | Fair $83,582 |
| Immigrants | Armenia | 27.0 /100 | #195 | Fair $83,555 |
| French | 26.0 /100 | #196 | Fair $83,468 |
| Aleuts | 25.7 /100 | #197 | Fair $83,446 |
| Japanese | 25.1 /100 | #198 | Fair $83,395 |
| Germans | 24.6 /100 | #199 | Fair $83,358 |
| Tsimshian | 24.5 /100 | #200 | Fair $83,346 |
| Spanish | 24.4 /100 | #201 | Fair $83,343 |
Demographics Similar to Guatemalans by Median Household Income
In terms of median household income, the demographic groups most similar to Guatemalans are Immigrants from Belize ($75,938, a difference of 0.030%), American ($75,932, a difference of 0.040%), German Russian ($75,856, a difference of 0.14%), Immigrants from Jamaica ($75,851, a difference of 0.15%), and Cape Verdean ($75,848, a difference of 0.15%).
| Demographics | Rating | Rank | Median Household Income |
| Immigrants | Senegal | 0.5 /100 | #257 | Tragic $76,915 |
| Immigrants | Nicaragua | 0.5 /100 | #258 | Tragic $76,784 |
| Spanish American Indians | 0.4 /100 | #259 | Tragic $76,670 |
| Jamaicans | 0.4 /100 | #260 | Tragic $76,583 |
| Immigrants | Grenada | 0.4 /100 | #261 | Tragic $76,517 |
| French American Indians | 0.4 /100 | #262 | Tragic $76,387 |
| Alaskan Athabascans | 0.4 /100 | #263 | Tragic $76,383 |
| Guatemalans | 0.3 /100 | #264 | Tragic $75,961 |
| Immigrants | Belize | 0.3 /100 | #265 | Tragic $75,938 |
| Americans | 0.3 /100 | #266 | Tragic $75,932 |
| German Russians | 0.3 /100 | #267 | Tragic $75,856 |
| Immigrants | Jamaica | 0.3 /100 | #268 | Tragic $75,851 |
| Cape Verdeans | 0.3 /100 | #269 | Tragic $75,848 |
| Hmong | 0.3 /100 | #270 | Tragic $75,839 |
| Pennsylvania Germans | 0.3 /100 | #271 | Tragic $75,814 |