German vs Hmong Median Household Income
COMPARE
German
Hmong
Median Household Income
Median Household Income Comparison
Germans
Hmong
$83,358
MEDIAN HOUSEHOLD INCOME
24.6/ 100
METRIC RATING
199th/ 347
METRIC RANK
$75,839
MEDIAN HOUSEHOLD INCOME
0.3/ 100
METRIC RATING
270th/ 347
METRIC RANK
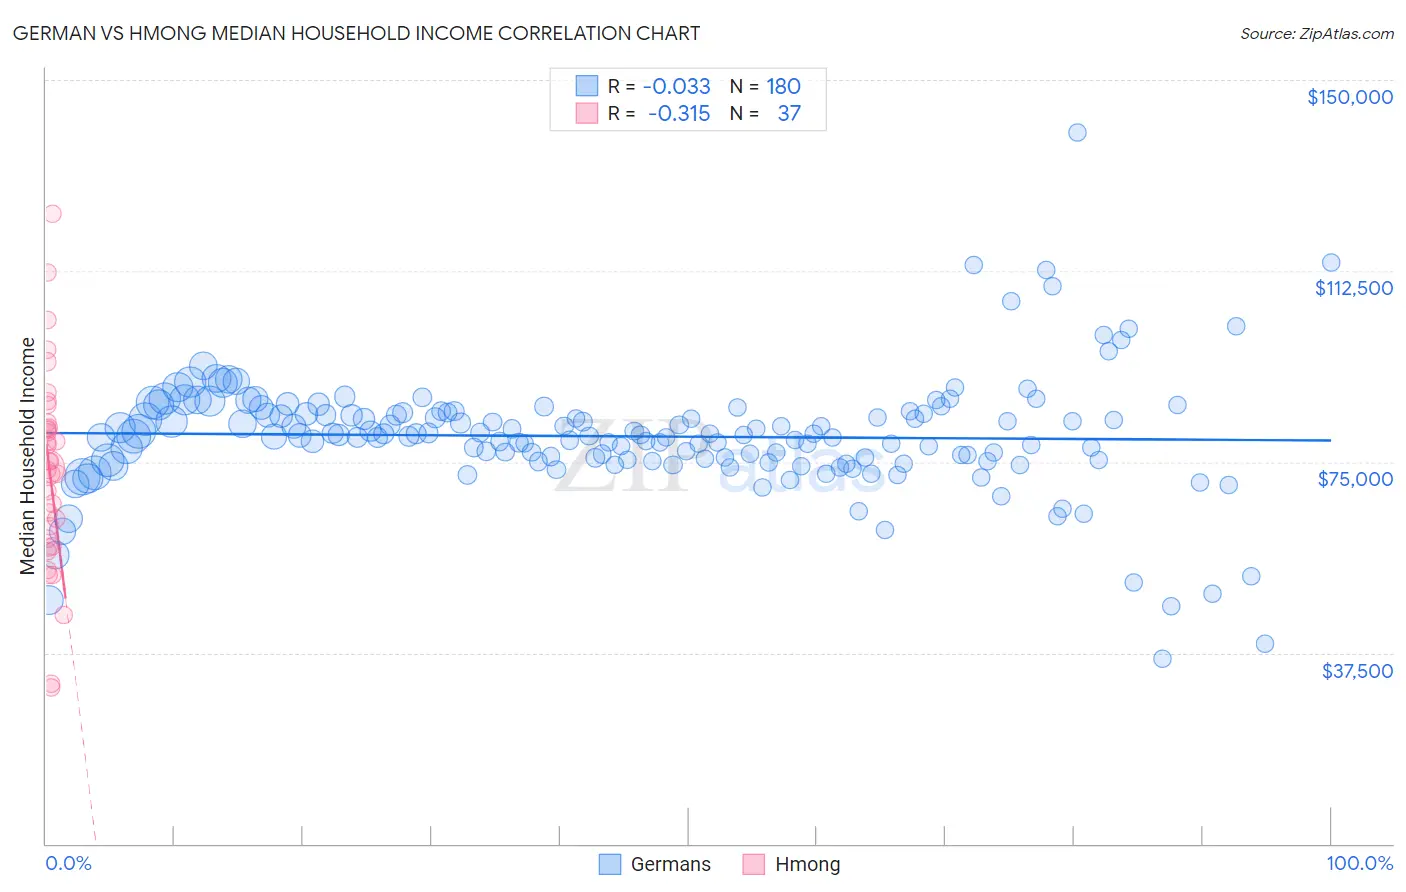
German vs Hmong Median Household Income Correlation Chart
The statistical analysis conducted on geographies consisting of 579,647,874 people shows no correlation between the proportion of Germans and median household income in the United States with a correlation coefficient (R) of -0.033 and weighted average of $83,358. Similarly, the statistical analysis conducted on geographies consisting of 24,655,529 people shows a mild negative correlation between the proportion of Hmong and median household income in the United States with a correlation coefficient (R) of -0.315 and weighted average of $75,839, a difference of 9.9%.
Median Household Income Correlation Summary
| Measurement | German | Hmong |
| Minimum | $36,331 | $30,679 |
| Maximum | $139,709 | $123,750 |
| Range | $103,378 | $93,071 |
| Mean | $80,014 | $73,160 |
| Median | $80,167 | $73,828 |
| Interquartile 25% (IQ1) | $75,354 | $59,130 |
| Interquartile 75% (IQ3) | $84,522 | $82,249 |
| Interquartile Range (IQR) | $9,168 | $23,119 |
| Standard Deviation (Sample) | $11,898 | $19,589 |
| Standard Deviation (Population) | $11,865 | $19,322 |
Similar Demographics by Median Household Income
Demographics Similar to Germans by Median Household Income
In terms of median household income, the demographic groups most similar to Germans are Tsimshian ($83,346, a difference of 0.010%), Spanish ($83,343, a difference of 0.020%), Japanese ($83,395, a difference of 0.040%), Immigrants from Thailand ($83,327, a difference of 0.040%), and Immigrants from Cambodia ($83,304, a difference of 0.070%).
| Demographics | Rating | Rank | Median Household Income |
| Welsh | 28.0 /100 | #192 | Fair $83,628 |
| Finns | 27.7 /100 | #193 | Fair $83,607 |
| Ghanaians | 27.4 /100 | #194 | Fair $83,582 |
| Immigrants | Armenia | 27.0 /100 | #195 | Fair $83,555 |
| French | 26.0 /100 | #196 | Fair $83,468 |
| Aleuts | 25.7 /100 | #197 | Fair $83,446 |
| Japanese | 25.1 /100 | #198 | Fair $83,395 |
| Germans | 24.6 /100 | #199 | Fair $83,358 |
| Tsimshian | 24.5 /100 | #200 | Fair $83,346 |
| Spanish | 24.4 /100 | #201 | Fair $83,343 |
| Immigrants | Thailand | 24.3 /100 | #202 | Fair $83,327 |
| Immigrants | Cambodia | 24.0 /100 | #203 | Fair $83,304 |
| Immigrants | Africa | 23.8 /100 | #204 | Fair $83,289 |
| Celtics | 22.7 /100 | #205 | Fair $83,193 |
| Immigrants | Kenya | 21.3 /100 | #206 | Fair $83,068 |
Demographics Similar to Hmong by Median Household Income
In terms of median household income, the demographic groups most similar to Hmong are Cape Verdean ($75,848, a difference of 0.010%), German Russian ($75,856, a difference of 0.020%), Immigrants from Jamaica ($75,851, a difference of 0.020%), Pennsylvania German ($75,814, a difference of 0.030%), and Somali ($75,782, a difference of 0.080%).
| Demographics | Rating | Rank | Median Household Income |
| Alaskan Athabascans | 0.4 /100 | #263 | Tragic $76,383 |
| Guatemalans | 0.3 /100 | #264 | Tragic $75,961 |
| Immigrants | Belize | 0.3 /100 | #265 | Tragic $75,938 |
| Americans | 0.3 /100 | #266 | Tragic $75,932 |
| German Russians | 0.3 /100 | #267 | Tragic $75,856 |
| Immigrants | Jamaica | 0.3 /100 | #268 | Tragic $75,851 |
| Cape Verdeans | 0.3 /100 | #269 | Tragic $75,848 |
| Hmong | 0.3 /100 | #270 | Tragic $75,839 |
| Pennsylvania Germans | 0.3 /100 | #271 | Tragic $75,814 |
| Somalis | 0.3 /100 | #272 | Tragic $75,782 |
| Liberians | 0.2 /100 | #273 | Tragic $75,667 |
| British West Indians | 0.2 /100 | #274 | Tragic $75,647 |
| Immigrants | Micronesia | 0.2 /100 | #275 | Tragic $75,574 |
| Immigrants | Latin America | 0.2 /100 | #276 | Tragic $75,420 |
| Spanish Americans | 0.2 /100 | #277 | Tragic $75,386 |