French Canadian vs Central American College, Under 1 year
COMPARE
French Canadian
Central American
College, Under 1 year
College, Under 1 year Comparison
French Canadians
Central Americans
64.2%
COLLEGE, UNDER 1 YEAR
16.3/ 100
METRIC RATING
201st/ 347
METRIC RANK
57.7%
COLLEGE, UNDER 1 YEAR
0.0/ 100
METRIC RATING
308th/ 347
METRIC RANK
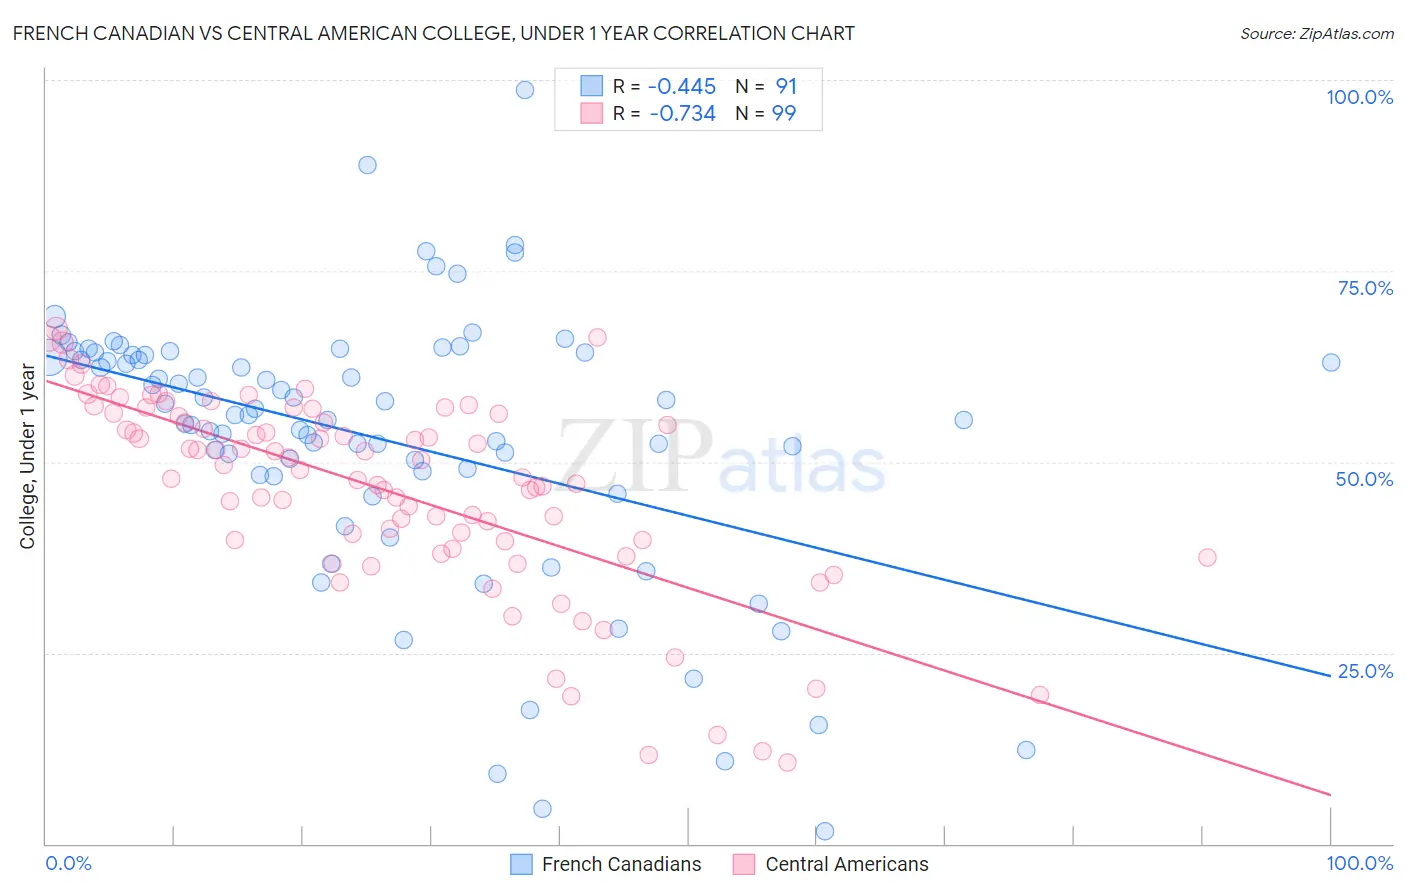
French Canadian vs Central American College, Under 1 year Correlation Chart
The statistical analysis conducted on geographies consisting of 502,676,235 people shows a moderate negative correlation between the proportion of French Canadians and percentage of population with at least college, under 1 year education in the United States with a correlation coefficient (R) of -0.445 and weighted average of 64.2%. Similarly, the statistical analysis conducted on geographies consisting of 504,615,987 people shows a strong negative correlation between the proportion of Central Americans and percentage of population with at least college, under 1 year education in the United States with a correlation coefficient (R) of -0.734 and weighted average of 57.7%, a difference of 11.4%.
College, Under 1 year Correlation Summary
| Measurement | French Canadian | Central American |
| Minimum | 1.7% | 10.7% |
| Maximum | 98.8% | 67.5% |
| Range | 97.1% | 56.8% |
| Mean | 53.0% | 46.4% |
| Median | 56.2% | 48.9% |
| Interquartile 25% (IQ1) | 48.3% | 39.6% |
| Interquartile 75% (IQ3) | 64.1% | 56.3% |
| Interquartile Range (IQR) | 15.8% | 16.7% |
| Standard Deviation (Sample) | 17.8% | 13.0% |
| Standard Deviation (Population) | 17.7% | 12.9% |
Similar Demographics by College, Under 1 year
Demographics Similar to French Canadians by College, Under 1 year
In terms of college, under 1 year, the demographic groups most similar to French Canadians are South American (64.2%, a difference of 0.010%), Nigerian (64.3%, a difference of 0.040%), Uruguayan (64.2%, a difference of 0.050%), Panamanian (64.3%, a difference of 0.060%), and Tsimshian (64.3%, a difference of 0.13%).
| Demographics | Rating | Rank | College, Under 1 year |
| Immigrants | Cameroon | 24.6 /100 | #194 | Fair 64.6% |
| Immigrants | South Eastern Asia | 22.1 /100 | #195 | Fair 64.5% |
| Tongans | 21.2 /100 | #196 | Fair 64.5% |
| Costa Ricans | 19.6 /100 | #197 | Poor 64.4% |
| Tsimshian | 17.9 /100 | #198 | Poor 64.3% |
| Panamanians | 17.0 /100 | #199 | Poor 64.3% |
| Nigerians | 16.7 /100 | #200 | Poor 64.3% |
| French Canadians | 16.3 /100 | #201 | Poor 64.2% |
| South Americans | 16.2 /100 | #202 | Poor 64.2% |
| Uruguayans | 15.6 /100 | #203 | Poor 64.2% |
| Immigrants | Zaire | 14.6 /100 | #204 | Poor 64.1% |
| Peruvians | 13.7 /100 | #205 | Poor 64.1% |
| Whites/Caucasians | 12.8 /100 | #206 | Poor 64.0% |
| Colombians | 12.4 /100 | #207 | Poor 64.0% |
| Immigrants | Vietnam | 12.1 /100 | #208 | Poor 64.0% |
Demographics Similar to Central Americans by College, Under 1 year
In terms of college, under 1 year, the demographic groups most similar to Central Americans are Fijian (57.7%, a difference of 0.0%), Immigrants from Portugal (57.7%, a difference of 0.010%), Immigrants from Nicaragua (57.6%, a difference of 0.12%), Haitian (57.8%, a difference of 0.21%), and Kiowa (57.8%, a difference of 0.32%).
| Demographics | Rating | Rank | College, Under 1 year |
| Mexican American Indians | 0.0 /100 | #301 | Tragic 58.1% |
| Apache | 0.0 /100 | #302 | Tragic 58.0% |
| Immigrants | Dominica | 0.0 /100 | #303 | Tragic 57.9% |
| Kiowa | 0.0 /100 | #304 | Tragic 57.8% |
| Haitians | 0.0 /100 | #305 | Tragic 57.8% |
| Immigrants | Portugal | 0.0 /100 | #306 | Tragic 57.7% |
| Fijians | 0.0 /100 | #307 | Tragic 57.7% |
| Central Americans | 0.0 /100 | #308 | Tragic 57.7% |
| Immigrants | Nicaragua | 0.0 /100 | #309 | Tragic 57.6% |
| Pueblo | 0.0 /100 | #310 | Tragic 57.4% |
| Cajuns | 0.0 /100 | #311 | Tragic 57.3% |
| Salvadorans | 0.0 /100 | #312 | Tragic 57.3% |
| Dutch West Indians | 0.0 /100 | #313 | Tragic 57.2% |
| Hopi | 0.0 /100 | #314 | Tragic 57.1% |
| Hondurans | 0.0 /100 | #315 | Tragic 57.1% |