French Canadian vs Central American Married-couple Households
COMPARE
French Canadian
Central American
Married-couple Households
Married-couple Households Comparison
French Canadians
Central Americans
47.5%
MARRIED-COUPLE HOUSEHOLDS
92.4/ 100
METRIC RATING
117th/ 347
METRIC RANK
43.9%
MARRIED-COUPLE HOUSEHOLDS
0.3/ 100
METRIC RATING
253rd/ 347
METRIC RANK
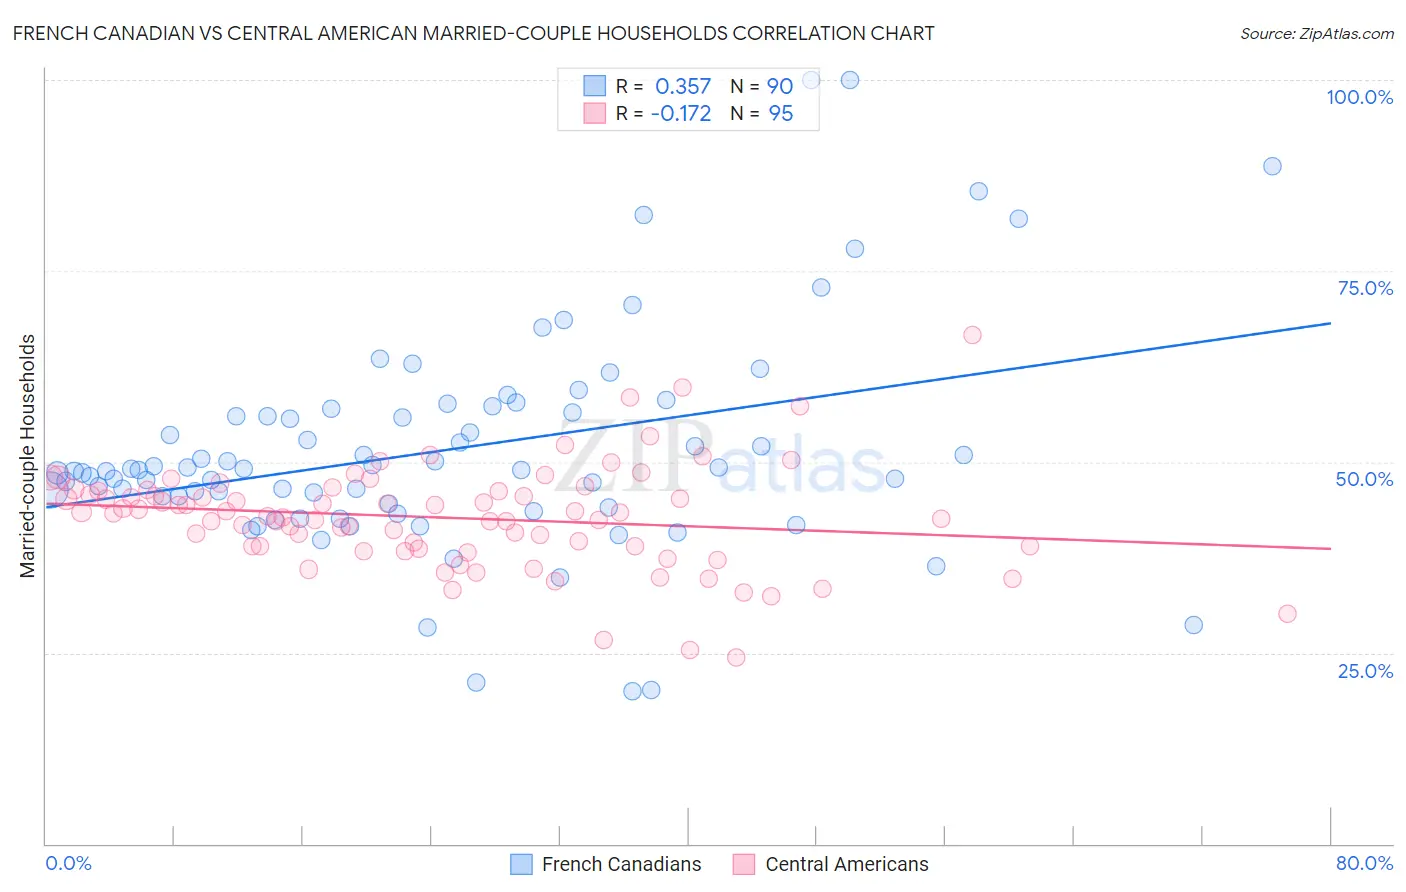
French Canadian vs Central American Married-couple Households Correlation Chart
The statistical analysis conducted on geographies consisting of 502,245,459 people shows a mild positive correlation between the proportion of French Canadians and percentage of married-couple family households in the United States with a correlation coefficient (R) of 0.357 and weighted average of 47.5%. Similarly, the statistical analysis conducted on geographies consisting of 504,046,022 people shows a poor negative correlation between the proportion of Central Americans and percentage of married-couple family households in the United States with a correlation coefficient (R) of -0.172 and weighted average of 43.9%, a difference of 8.2%.
Married-couple Households Correlation Summary
| Measurement | French Canadian | Central American |
| Minimum | 19.9% | 24.4% |
| Maximum | 100.0% | 66.7% |
| Range | 80.1% | 42.3% |
| Mean | 51.6% | 42.7% |
| Median | 48.9% | 43.2% |
| Interquartile 25% (IQ1) | 44.5% | 38.9% |
| Interquartile 75% (IQ3) | 56.5% | 46.2% |
| Interquartile Range (IQR) | 12.0% | 7.3% |
| Standard Deviation (Sample) | 14.4% | 6.8% |
| Standard Deviation (Population) | 14.4% | 6.8% |
Similar Demographics by Married-couple Households
Demographics Similar to French Canadians by Married-couple Households
In terms of married-couple households, the demographic groups most similar to French Canadians are Argentinean (47.5%, a difference of 0.010%), Immigrants from Germany (47.5%, a difference of 0.010%), Chilean (47.5%, a difference of 0.030%), Slovak (47.6%, a difference of 0.060%), and Immigrants from Europe (47.6%, a difference of 0.18%).
| Demographics | Rating | Rank | Married-couple Households |
| Macedonians | 93.9 /100 | #110 | Exceptional 47.6% |
| Syrians | 93.9 /100 | #111 | Exceptional 47.6% |
| Peruvians | 93.8 /100 | #112 | Exceptional 47.6% |
| Venezuelans | 93.8 /100 | #113 | Exceptional 47.6% |
| Immigrants | Europe | 93.7 /100 | #114 | Exceptional 47.6% |
| Slovaks | 92.9 /100 | #115 | Exceptional 47.6% |
| Argentineans | 92.5 /100 | #116 | Exceptional 47.5% |
| French Canadians | 92.4 /100 | #117 | Exceptional 47.5% |
| Immigrants | Germany | 92.4 /100 | #118 | Exceptional 47.5% |
| Chileans | 92.2 /100 | #119 | Exceptional 47.5% |
| Puget Sound Salish | 90.5 /100 | #120 | Exceptional 47.4% |
| Immigrants | Eastern Europe | 90.3 /100 | #121 | Exceptional 47.4% |
| Okinawans | 90.1 /100 | #122 | Exceptional 47.4% |
| Immigrants | Venezuela | 89.3 /100 | #123 | Excellent 47.4% |
| Zimbabweans | 89.2 /100 | #124 | Excellent 47.4% |
Demographics Similar to Central Americans by Married-couple Households
In terms of married-couple households, the demographic groups most similar to Central Americans are Apache (43.9%, a difference of 0.050%), Shoshone (43.9%, a difference of 0.070%), Seminole (44.0%, a difference of 0.12%), German Russian (44.0%, a difference of 0.19%), and Ugandan (43.8%, a difference of 0.21%).
| Demographics | Rating | Rank | Married-couple Households |
| Immigrants | Cuba | 0.6 /100 | #246 | Tragic 44.2% |
| Immigrants | Morocco | 0.6 /100 | #247 | Tragic 44.2% |
| Yup'ik | 0.4 /100 | #248 | Tragic 44.1% |
| Immigrants | Kenya | 0.4 /100 | #249 | Tragic 44.1% |
| French American Indians | 0.4 /100 | #250 | Tragic 44.1% |
| German Russians | 0.4 /100 | #251 | Tragic 44.0% |
| Seminole | 0.4 /100 | #252 | Tragic 44.0% |
| Central Americans | 0.3 /100 | #253 | Tragic 43.9% |
| Apache | 0.3 /100 | #254 | Tragic 43.9% |
| Shoshone | 0.3 /100 | #255 | Tragic 43.9% |
| Ugandans | 0.3 /100 | #256 | Tragic 43.8% |
| Blackfeet | 0.2 /100 | #257 | Tragic 43.8% |
| Central American Indians | 0.2 /100 | #258 | Tragic 43.8% |
| Iroquois | 0.2 /100 | #259 | Tragic 43.7% |
| Immigrants | Cameroon | 0.2 /100 | #260 | Tragic 43.7% |