Sri Lankan vs Central American Median Female Earnings
COMPARE
Sri Lankan
Central American
Median Female Earnings
Median Female Earnings Comparison
Sri Lankans
Central Americans
$40,496
MEDIAN FEMALE EARNINGS
84.0/ 100
METRIC RATING
142nd/ 347
METRIC RANK
$36,492
MEDIAN FEMALE EARNINGS
0.1/ 100
METRIC RATING
276th/ 347
METRIC RANK
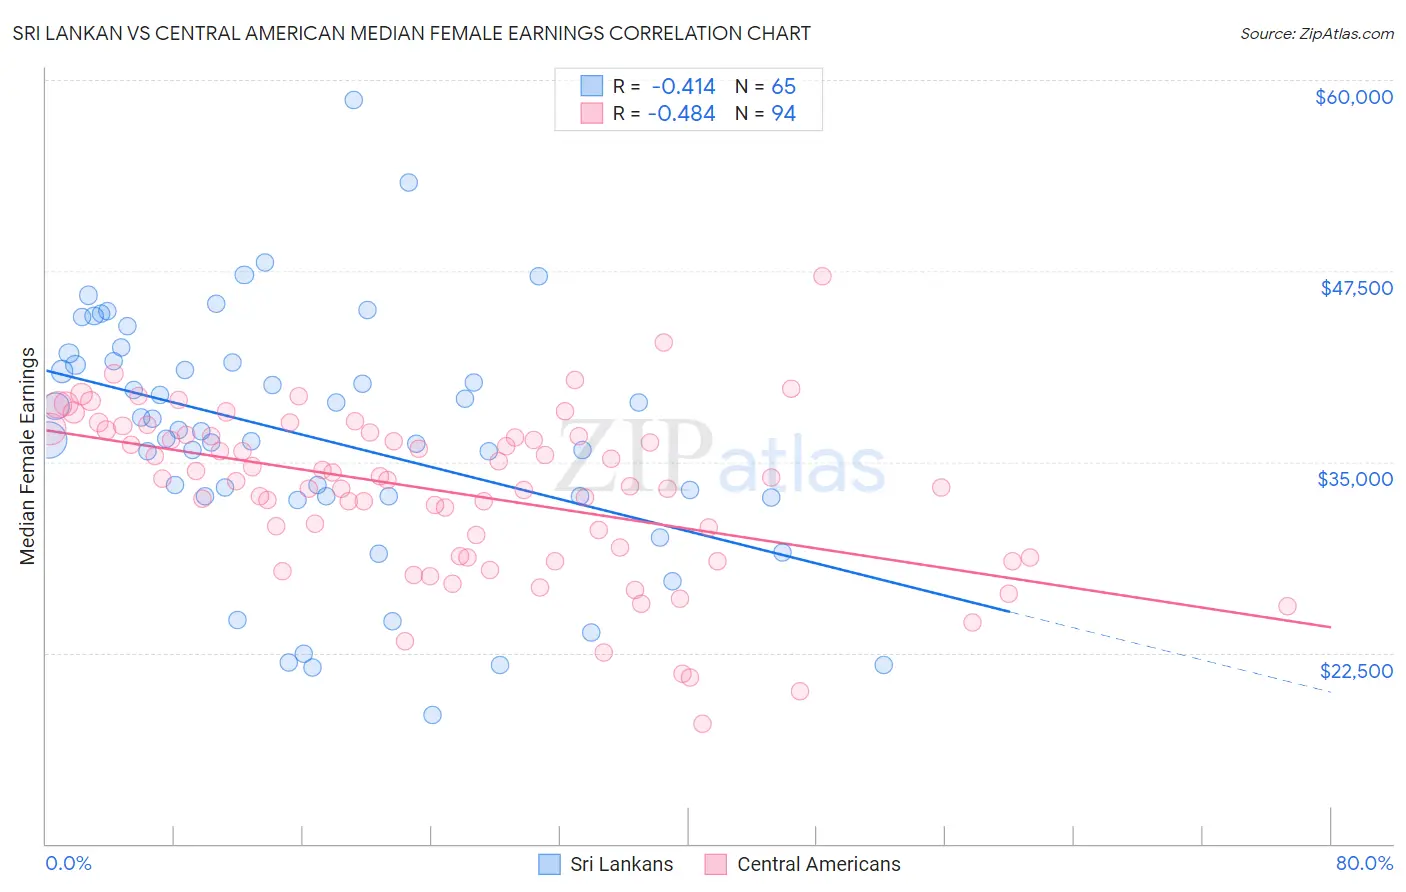
Sri Lankan vs Central American Median Female Earnings Correlation Chart
The statistical analysis conducted on geographies consisting of 440,466,993 people shows a moderate negative correlation between the proportion of Sri Lankans and median female earnings in the United States with a correlation coefficient (R) of -0.414 and weighted average of $40,496. Similarly, the statistical analysis conducted on geographies consisting of 504,159,806 people shows a moderate negative correlation between the proportion of Central Americans and median female earnings in the United States with a correlation coefficient (R) of -0.484 and weighted average of $36,492, a difference of 11.0%.
Median Female Earnings Correlation Summary
| Measurement | Sri Lankan | Central American |
| Minimum | $18,441 | $17,895 |
| Maximum | $58,654 | $47,188 |
| Range | $40,213 | $29,293 |
| Mean | $36,602 | $33,080 |
| Median | $36,994 | $33,869 |
| Interquartile 25% (IQ1) | $32,729 | $28,801 |
| Interquartile 75% (IQ3) | $41,553 | $36,751 |
| Interquartile Range (IQR) | $8,824 | $7,950 |
| Standard Deviation (Sample) | $8,074 | $5,364 |
| Standard Deviation (Population) | $8,012 | $5,336 |
Similar Demographics by Median Female Earnings
Demographics Similar to Sri Lankans by Median Female Earnings
In terms of median female earnings, the demographic groups most similar to Sri Lankans are Immigrants from Syria ($40,499, a difference of 0.010%), Northern European ($40,491, a difference of 0.010%), Immigrants from North Macedonia ($40,488, a difference of 0.020%), Brazilian ($40,483, a difference of 0.030%), and Serbian ($40,539, a difference of 0.10%).
| Demographics | Rating | Rank | Median Female Earnings |
| Immigrants | Nepal | 89.0 /100 | #135 | Excellent $40,704 |
| Immigrants | Eastern Africa | 87.7 /100 | #136 | Excellent $40,644 |
| Pakistanis | 86.6 /100 | #137 | Excellent $40,596 |
| Taiwanese | 86.1 /100 | #138 | Excellent $40,576 |
| Immigrants | South Eastern Asia | 85.7 /100 | #139 | Excellent $40,558 |
| Serbians | 85.2 /100 | #140 | Excellent $40,539 |
| Immigrants | Syria | 84.1 /100 | #141 | Excellent $40,499 |
| Sri Lankans | 84.0 /100 | #142 | Excellent $40,496 |
| Northern Europeans | 83.9 /100 | #143 | Excellent $40,491 |
| Immigrants | North Macedonia | 83.8 /100 | #144 | Excellent $40,488 |
| Brazilians | 83.6 /100 | #145 | Excellent $40,483 |
| Ghanaians | 82.1 /100 | #146 | Excellent $40,429 |
| Vietnamese | 80.4 /100 | #147 | Excellent $40,377 |
| Poles | 80.2 /100 | #148 | Excellent $40,371 |
| Immigrants | Cameroon | 79.7 /100 | #149 | Good $40,354 |
Demographics Similar to Central Americans by Median Female Earnings
In terms of median female earnings, the demographic groups most similar to Central Americans are Marshallese ($36,459, a difference of 0.090%), African ($36,530, a difference of 0.10%), U.S. Virgin Islander ($36,424, a difference of 0.19%), Immigrants from Caribbean ($36,414, a difference of 0.22%), and Iroquois ($36,408, a difference of 0.23%).
| Demographics | Rating | Rank | Median Female Earnings |
| Immigrants | Venezuela | 0.4 /100 | #269 | Tragic $37,003 |
| French American Indians | 0.3 /100 | #270 | Tragic $36,920 |
| Nicaraguans | 0.3 /100 | #271 | Tragic $36,904 |
| Immigrants | Dominican Republic | 0.3 /100 | #272 | Tragic $36,857 |
| Immigrants | Laos | 0.3 /100 | #273 | Tragic $36,841 |
| Immigrants | El Salvador | 0.2 /100 | #274 | Tragic $36,673 |
| Africans | 0.1 /100 | #275 | Tragic $36,530 |
| Central Americans | 0.1 /100 | #276 | Tragic $36,492 |
| Marshallese | 0.1 /100 | #277 | Tragic $36,459 |
| U.S. Virgin Islanders | 0.1 /100 | #278 | Tragic $36,424 |
| Immigrants | Caribbean | 0.1 /100 | #279 | Tragic $36,414 |
| Iroquois | 0.1 /100 | #280 | Tragic $36,408 |
| Spanish Americans | 0.1 /100 | #281 | Tragic $36,391 |
| Haitians | 0.1 /100 | #282 | Tragic $36,374 |
| Immigrants | Haiti | 0.1 /100 | #283 | Tragic $36,203 |