Finnish vs South American Householder Income Ages 25 - 44 years
COMPARE
Finnish
South American
Householder Income Ages 25 - 44 years
Householder Income Ages 25 - 44 years Comparison
Finns
South Americans
$94,610
HOUSEHOLDER INCOME AGES 25 - 44 YEARS
50.6/ 100
METRIC RATING
173rd/ 347
METRIC RANK
$95,362
HOUSEHOLDER INCOME AGES 25 - 44 YEARS
60.9/ 100
METRIC RATING
164th/ 347
METRIC RANK
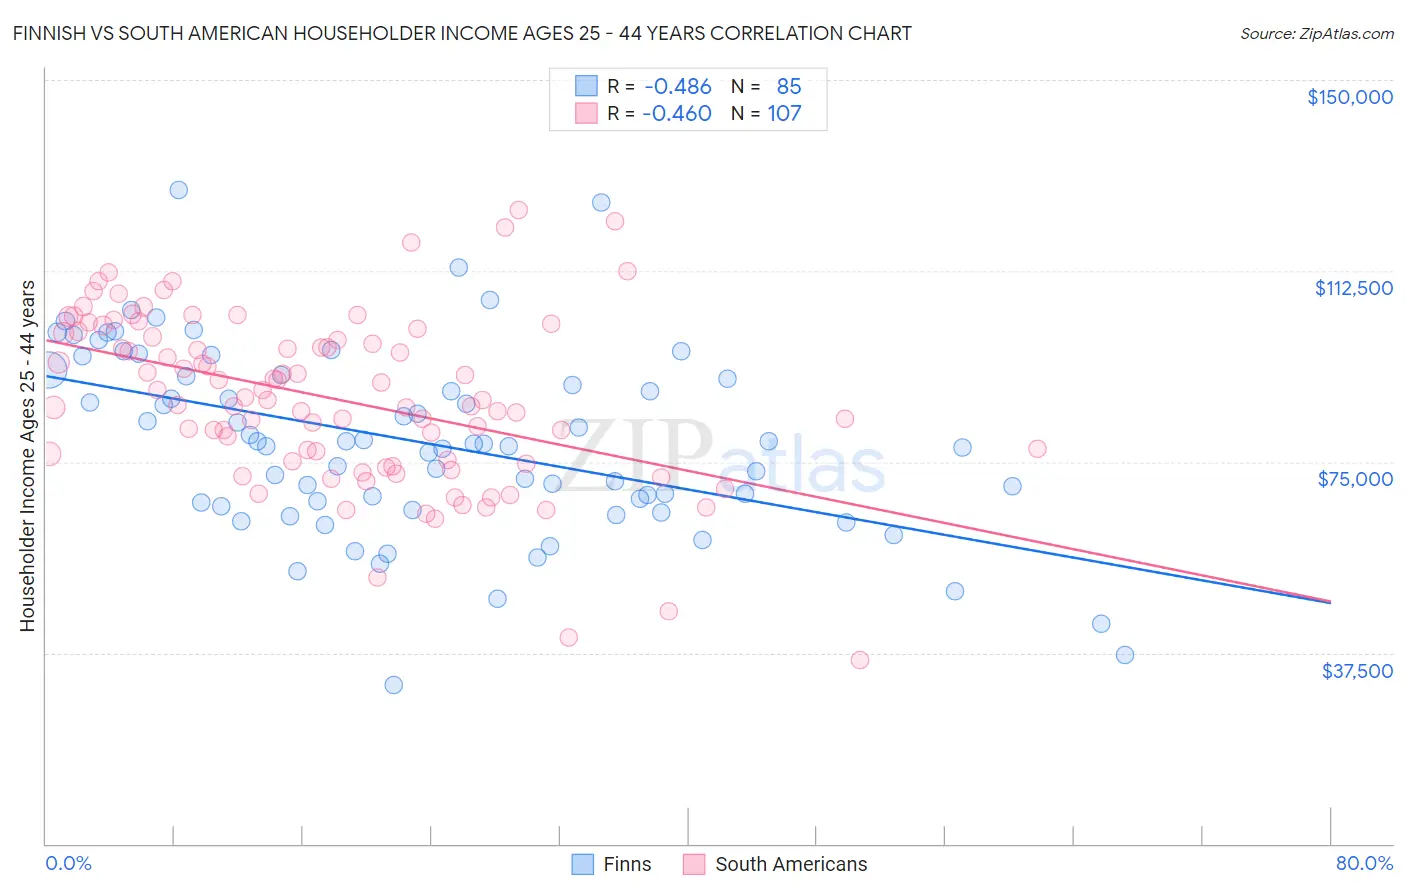
Finnish vs South American Householder Income Ages 25 - 44 years Correlation Chart
The statistical analysis conducted on geographies consisting of 403,262,071 people shows a moderate negative correlation between the proportion of Finns and household income with householder between the ages 25 and 44 in the United States with a correlation coefficient (R) of -0.486 and weighted average of $94,610. Similarly, the statistical analysis conducted on geographies consisting of 492,106,064 people shows a moderate negative correlation between the proportion of South Americans and household income with householder between the ages 25 and 44 in the United States with a correlation coefficient (R) of -0.460 and weighted average of $95,362, a difference of 0.79%.
Householder Income Ages 25 - 44 years Correlation Summary
| Measurement | Finnish | South American |
| Minimum | $31,250 | $36,176 |
| Maximum | $128,513 | $124,375 |
| Range | $97,263 | $88,199 |
| Mean | $78,807 | $87,458 |
| Median | $78,652 | $87,265 |
| Interquartile 25% (IQ1) | $66,639 | $75,189 |
| Interquartile 75% (IQ3) | $91,884 | $100,291 |
| Interquartile Range (IQR) | $25,244 | $25,102 |
| Standard Deviation (Sample) | $18,378 | $16,777 |
| Standard Deviation (Population) | $18,270 | $16,698 |
Demographics Similar to Finns and South Americans by Householder Income Ages 25 - 44 years
In terms of householder income ages 25 - 44 years, the demographic groups most similar to Finns are Scottish ($94,622, a difference of 0.010%), Colombian ($94,565, a difference of 0.050%), English ($94,429, a difference of 0.19%), Immigrants ($94,423, a difference of 0.20%), and Immigrants from Armenia ($94,867, a difference of 0.27%). Similarly, the demographic groups most similar to South Americans are Immigrants from Nepal ($95,322, a difference of 0.040%), Immigrants from Saudi Arabia ($95,450, a difference of 0.090%), Immigrants from Ethiopia ($95,256, a difference of 0.11%), Immigrants from Portugal ($95,512, a difference of 0.16%), and Swiss ($95,511, a difference of 0.16%).
| Demographics | Rating | Rank | Householder Income Ages 25 - 44 years |
| Scandinavians | 63.9 /100 | #158 | Good $95,596 |
| Costa Ricans | 63.5 /100 | #159 | Good $95,565 |
| Icelanders | 63.4 /100 | #160 | Good $95,560 |
| Immigrants | Portugal | 62.8 /100 | #161 | Good $95,512 |
| Swiss | 62.8 /100 | #162 | Good $95,511 |
| Immigrants | Saudi Arabia | 62.0 /100 | #163 | Good $95,450 |
| South Americans | 60.9 /100 | #164 | Good $95,362 |
| Immigrants | Nepal | 60.3 /100 | #165 | Good $95,322 |
| Immigrants | Ethiopia | 59.5 /100 | #166 | Average $95,256 |
| Czechoslovakians | 57.0 /100 | #167 | Average $95,070 |
| Alsatians | 56.8 /100 | #168 | Average $95,059 |
| Native Hawaiians | 56.8 /100 | #169 | Average $95,058 |
| Slovaks | 56.4 /100 | #170 | Average $95,032 |
| Immigrants | Armenia | 54.2 /100 | #171 | Average $94,867 |
| Scottish | 50.8 /100 | #172 | Average $94,622 |
| Finns | 50.6 /100 | #173 | Average $94,610 |
| Colombians | 50.0 /100 | #174 | Average $94,565 |
| English | 48.1 /100 | #175 | Average $94,429 |
| Immigrants | Immigrants | 48.0 /100 | #176 | Average $94,423 |
| Belgians | 45.8 /100 | #177 | Average $94,262 |
| Immigrants | South America | 42.8 /100 | #178 | Average $94,042 |