Finnish vs Immigrants from Syria Householder Income Ages 25 - 44 years
COMPARE
Finnish
Immigrants from Syria
Householder Income Ages 25 - 44 years
Householder Income Ages 25 - 44 years Comparison
Finns
Immigrants from Syria
$94,610
HOUSEHOLDER INCOME AGES 25 - 44 YEARS
50.6/ 100
METRIC RATING
173rd/ 347
METRIC RANK
$96,789
HOUSEHOLDER INCOME AGES 25 - 44 YEARS
77.4/ 100
METRIC RATING
147th/ 347
METRIC RANK
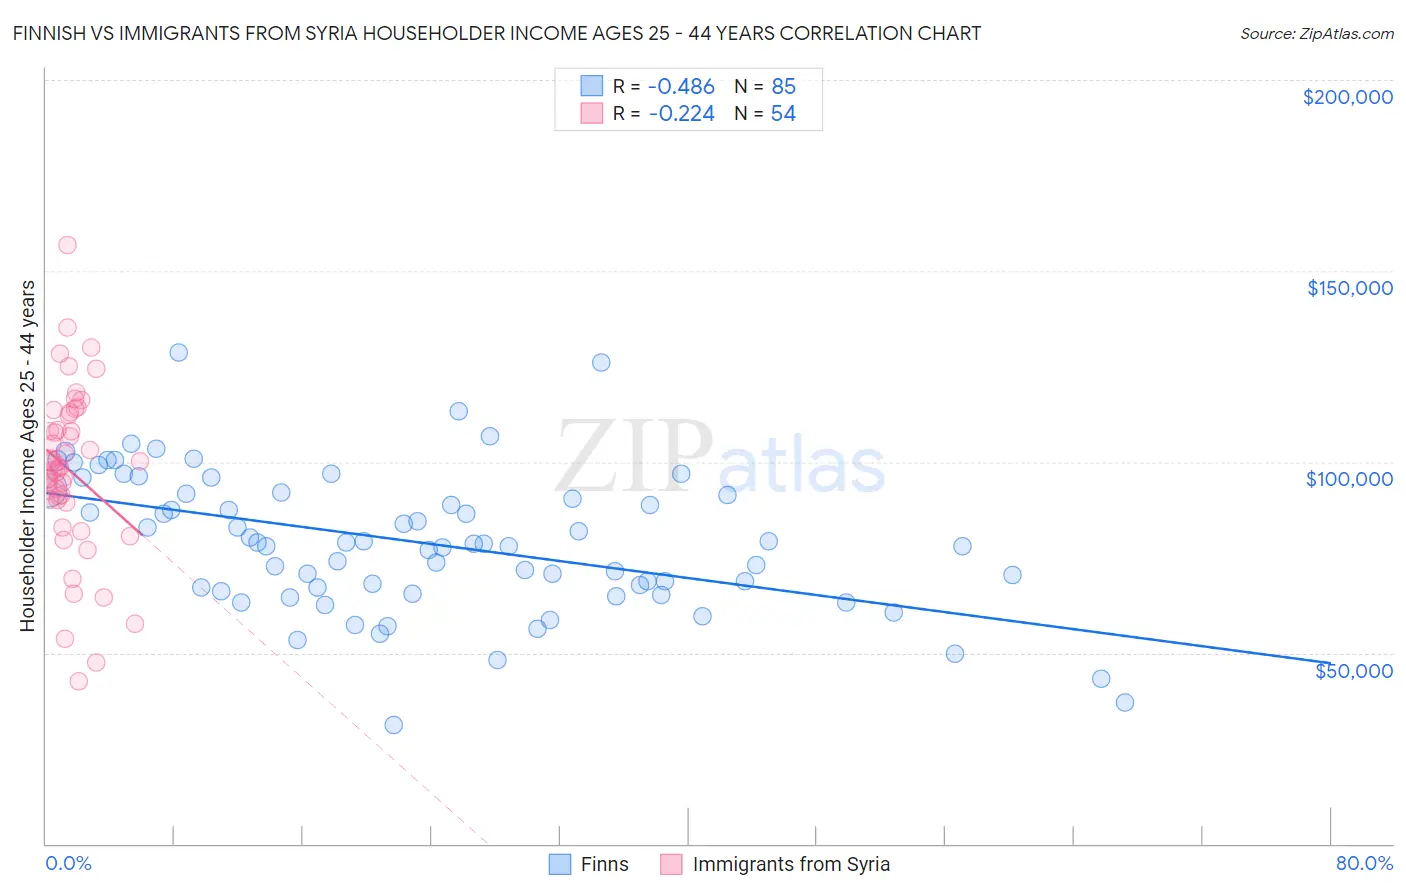
Finnish vs Immigrants from Syria Householder Income Ages 25 - 44 years Correlation Chart
The statistical analysis conducted on geographies consisting of 403,262,071 people shows a moderate negative correlation between the proportion of Finns and household income with householder between the ages 25 and 44 in the United States with a correlation coefficient (R) of -0.486 and weighted average of $94,610. Similarly, the statistical analysis conducted on geographies consisting of 174,044,447 people shows a weak negative correlation between the proportion of Immigrants from Syria and household income with householder between the ages 25 and 44 in the United States with a correlation coefficient (R) of -0.224 and weighted average of $96,789, a difference of 2.3%.
Householder Income Ages 25 - 44 years Correlation Summary
| Measurement | Finnish | Immigrants from Syria |
| Minimum | $31,250 | $42,492 |
| Maximum | $128,513 | $156,643 |
| Range | $97,263 | $114,151 |
| Mean | $78,807 | $97,715 |
| Median | $78,652 | $98,566 |
| Interquartile 25% (IQ1) | $66,639 | $90,047 |
| Interquartile 75% (IQ3) | $91,884 | $112,269 |
| Interquartile Range (IQR) | $25,244 | $22,222 |
| Standard Deviation (Sample) | $18,378 | $21,833 |
| Standard Deviation (Population) | $18,270 | $21,629 |
Similar Demographics by Householder Income Ages 25 - 44 years
Demographics Similar to Finns by Householder Income Ages 25 - 44 years
In terms of householder income ages 25 - 44 years, the demographic groups most similar to Finns are Scottish ($94,622, a difference of 0.010%), Colombian ($94,565, a difference of 0.050%), English ($94,429, a difference of 0.19%), Immigrants ($94,423, a difference of 0.20%), and Immigrants from Armenia ($94,867, a difference of 0.27%).
| Demographics | Rating | Rank | Householder Income Ages 25 - 44 years |
| Immigrants | Ethiopia | 59.5 /100 | #166 | Average $95,256 |
| Czechoslovakians | 57.0 /100 | #167 | Average $95,070 |
| Alsatians | 56.8 /100 | #168 | Average $95,059 |
| Native Hawaiians | 56.8 /100 | #169 | Average $95,058 |
| Slovaks | 56.4 /100 | #170 | Average $95,032 |
| Immigrants | Armenia | 54.2 /100 | #171 | Average $94,867 |
| Scottish | 50.8 /100 | #172 | Average $94,622 |
| Finns | 50.6 /100 | #173 | Average $94,610 |
| Colombians | 50.0 /100 | #174 | Average $94,565 |
| English | 48.1 /100 | #175 | Average $94,429 |
| Immigrants | Immigrants | 48.0 /100 | #176 | Average $94,423 |
| Belgians | 45.8 /100 | #177 | Average $94,262 |
| Immigrants | South America | 42.8 /100 | #178 | Average $94,042 |
| French Canadians | 38.2 /100 | #179 | Fair $93,694 |
| French | 37.8 /100 | #180 | Fair $93,665 |
Demographics Similar to Immigrants from Syria by Householder Income Ages 25 - 44 years
In terms of householder income ages 25 - 44 years, the demographic groups most similar to Immigrants from Syria are Ethiopian ($96,824, a difference of 0.040%), Irish ($96,730, a difference of 0.060%), Norwegian ($96,866, a difference of 0.080%), Basque ($96,709, a difference of 0.080%), and Ugandan ($96,667, a difference of 0.13%).
| Demographics | Rating | Rank | Householder Income Ages 25 - 44 years |
| Immigrants | Morocco | 82.0 /100 | #140 | Excellent $97,305 |
| Luxembourgers | 81.5 /100 | #141 | Excellent $97,237 |
| Danes | 81.3 /100 | #142 | Excellent $97,221 |
| Immigrants | Jordan | 81.0 /100 | #143 | Excellent $97,185 |
| Immigrants | Chile | 80.8 /100 | #144 | Excellent $97,159 |
| Norwegians | 78.2 /100 | #145 | Good $96,866 |
| Ethiopians | 77.8 /100 | #146 | Good $96,824 |
| Immigrants | Syria | 77.4 /100 | #147 | Good $96,789 |
| Irish | 76.9 /100 | #148 | Good $96,730 |
| Basques | 76.6 /100 | #149 | Good $96,709 |
| Ugandans | 76.2 /100 | #150 | Good $96,667 |
| Czechs | 74.8 /100 | #151 | Good $96,525 |
| South American Indians | 74.5 /100 | #152 | Good $96,497 |
| Slovenes | 73.9 /100 | #153 | Good $96,439 |
| Slavs | 73.2 /100 | #154 | Good $96,377 |