Immigrants from Peru vs Paraguayan Householder Income Ages 25 - 44 years
COMPARE
Immigrants from Peru
Paraguayan
Householder Income Ages 25 - 44 years
Householder Income Ages 25 - 44 years Comparison
Immigrants from Peru
Paraguayans
$97,329
HOUSEHOLDER INCOME AGES 25 - 44 YEARS
82.2/ 100
METRIC RATING
139th/ 347
METRIC RANK
$106,615
HOUSEHOLDER INCOME AGES 25 - 44 YEARS
99.9/ 100
METRIC RATING
54th/ 347
METRIC RANK
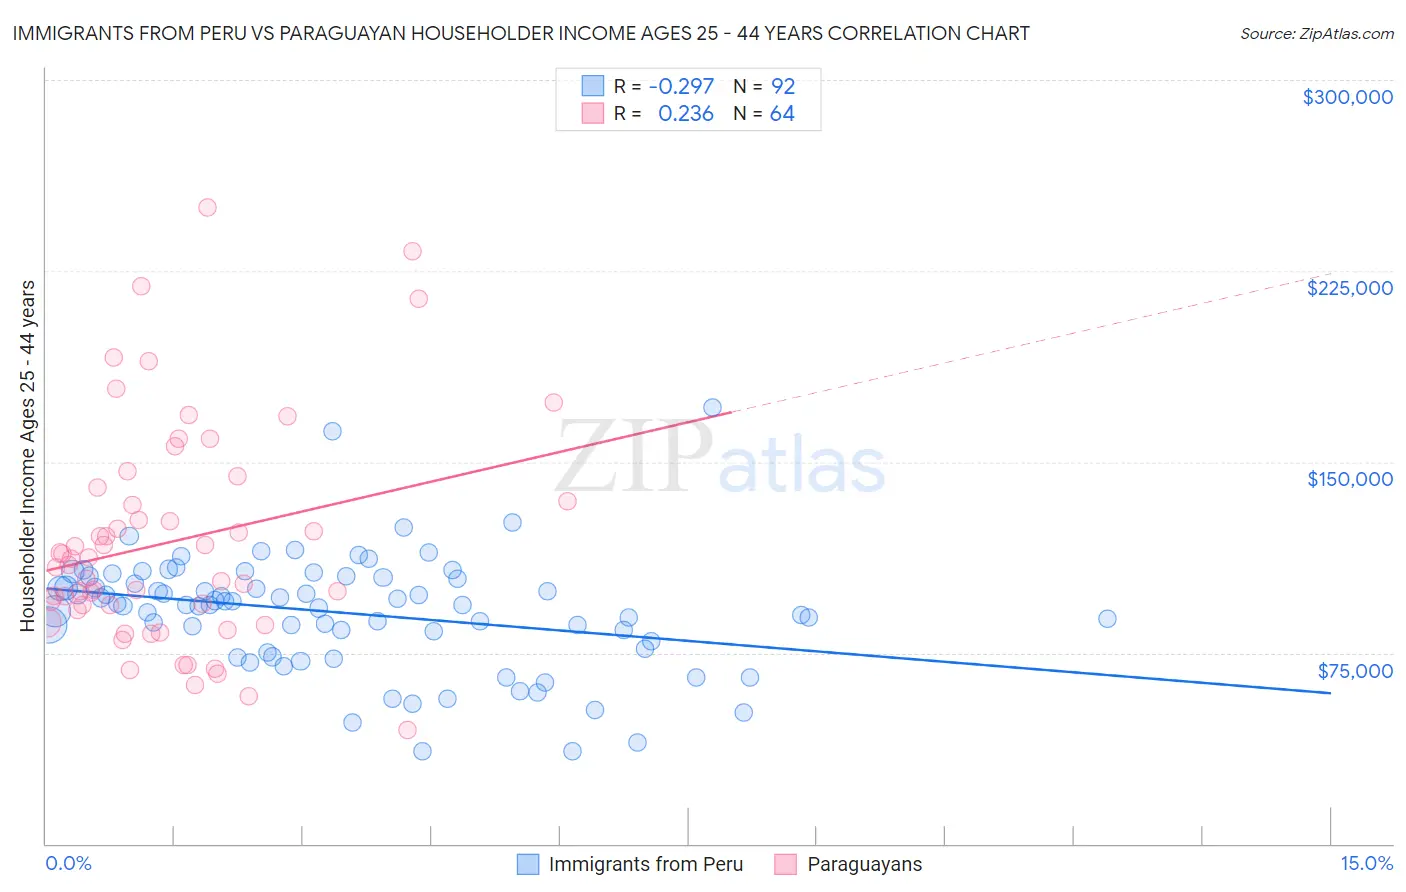
Immigrants from Peru vs Paraguayan Householder Income Ages 25 - 44 years Correlation Chart
The statistical analysis conducted on geographies consisting of 328,285,431 people shows a weak negative correlation between the proportion of Immigrants from Peru and household income with householder between the ages 25 and 44 in the United States with a correlation coefficient (R) of -0.297 and weighted average of $97,329. Similarly, the statistical analysis conducted on geographies consisting of 95,064,086 people shows a weak positive correlation between the proportion of Paraguayans and household income with householder between the ages 25 and 44 in the United States with a correlation coefficient (R) of 0.236 and weighted average of $106,615, a difference of 9.5%.
Householder Income Ages 25 - 44 years Correlation Summary
| Measurement | Immigrants from Peru | Paraguayan |
| Minimum | $36,176 | $44,531 |
| Maximum | $171,373 | $250,001 |
| Range | $135,197 | $205,470 |
| Mean | $90,702 | $118,848 |
| Median | $93,723 | $110,860 |
| Interquartile 25% (IQ1) | $77,980 | $92,713 |
| Interquartile 75% (IQ3) | $104,309 | $137,201 |
| Interquartile Range (IQR) | $26,329 | $44,488 |
| Standard Deviation (Sample) | $22,743 | $43,421 |
| Standard Deviation (Population) | $22,619 | $43,080 |
Similar Demographics by Householder Income Ages 25 - 44 years
Demographics Similar to Immigrants from Peru by Householder Income Ages 25 - 44 years
In terms of householder income ages 25 - 44 years, the demographic groups most similar to Immigrants from Peru are Lebanese ($97,339, a difference of 0.010%), Arab ($97,336, a difference of 0.010%), Immigrants from Morocco ($97,305, a difference of 0.020%), Luxembourger ($97,237, a difference of 0.090%), and Danish ($97,221, a difference of 0.11%).
| Demographics | Rating | Rank | Householder Income Ages 25 - 44 years |
| Immigrants | Zimbabwe | 86.3 /100 | #132 | Excellent $97,880 |
| Tsimshian | 85.8 /100 | #133 | Excellent $97,809 |
| Canadians | 84.5 /100 | #134 | Excellent $97,625 |
| Immigrants | Oceania | 84.5 /100 | #135 | Excellent $97,623 |
| Hungarians | 83.9 /100 | #136 | Excellent $97,544 |
| Lebanese | 82.3 /100 | #137 | Excellent $97,339 |
| Arabs | 82.3 /100 | #138 | Excellent $97,336 |
| Immigrants | Peru | 82.2 /100 | #139 | Excellent $97,329 |
| Immigrants | Morocco | 82.0 /100 | #140 | Excellent $97,305 |
| Luxembourgers | 81.5 /100 | #141 | Excellent $97,237 |
| Danes | 81.3 /100 | #142 | Excellent $97,221 |
| Immigrants | Jordan | 81.0 /100 | #143 | Excellent $97,185 |
| Immigrants | Chile | 80.8 /100 | #144 | Excellent $97,159 |
| Norwegians | 78.2 /100 | #145 | Good $96,866 |
| Ethiopians | 77.8 /100 | #146 | Good $96,824 |
Demographics Similar to Paraguayans by Householder Income Ages 25 - 44 years
In terms of householder income ages 25 - 44 years, the demographic groups most similar to Paraguayans are Immigrants from Norway ($106,629, a difference of 0.010%), Greek ($106,457, a difference of 0.15%), Immigrants from Europe ($106,817, a difference of 0.19%), Immigrants from Czechoslovakia ($106,888, a difference of 0.26%), and Immigrants from Pakistan ($106,129, a difference of 0.46%).
| Demographics | Rating | Rank | Householder Income Ages 25 - 44 years |
| Estonians | 99.9 /100 | #47 | Exceptional $107,269 |
| Bulgarians | 99.9 /100 | #48 | Exceptional $107,264 |
| Immigrants | Turkey | 99.9 /100 | #49 | Exceptional $107,258 |
| Cambodians | 99.9 /100 | #50 | Exceptional $107,148 |
| Immigrants | Czechoslovakia | 99.9 /100 | #51 | Exceptional $106,888 |
| Immigrants | Europe | 99.9 /100 | #52 | Exceptional $106,817 |
| Immigrants | Norway | 99.9 /100 | #53 | Exceptional $106,629 |
| Paraguayans | 99.9 /100 | #54 | Exceptional $106,615 |
| Greeks | 99.9 /100 | #55 | Exceptional $106,457 |
| Immigrants | Pakistan | 99.8 /100 | #56 | Exceptional $106,129 |
| Immigrants | Austria | 99.8 /100 | #57 | Exceptional $106,103 |
| Immigrants | South Africa | 99.8 /100 | #58 | Exceptional $105,748 |
| Immigrants | Latvia | 99.8 /100 | #59 | Exceptional $105,522 |
| Egyptians | 99.7 /100 | #60 | Exceptional $105,282 |
| Lithuanians | 99.7 /100 | #61 | Exceptional $105,223 |