Finnish vs Immigrants from Liberia Householder Income Ages 25 - 44 years
COMPARE
Finnish
Immigrants from Liberia
Householder Income Ages 25 - 44 years
Householder Income Ages 25 - 44 years Comparison
Finns
Immigrants from Liberia
$94,610
HOUSEHOLDER INCOME AGES 25 - 44 YEARS
50.6/ 100
METRIC RATING
173rd/ 347
METRIC RANK
$80,863
HOUSEHOLDER INCOME AGES 25 - 44 YEARS
0.1/ 100
METRIC RATING
299th/ 347
METRIC RANK
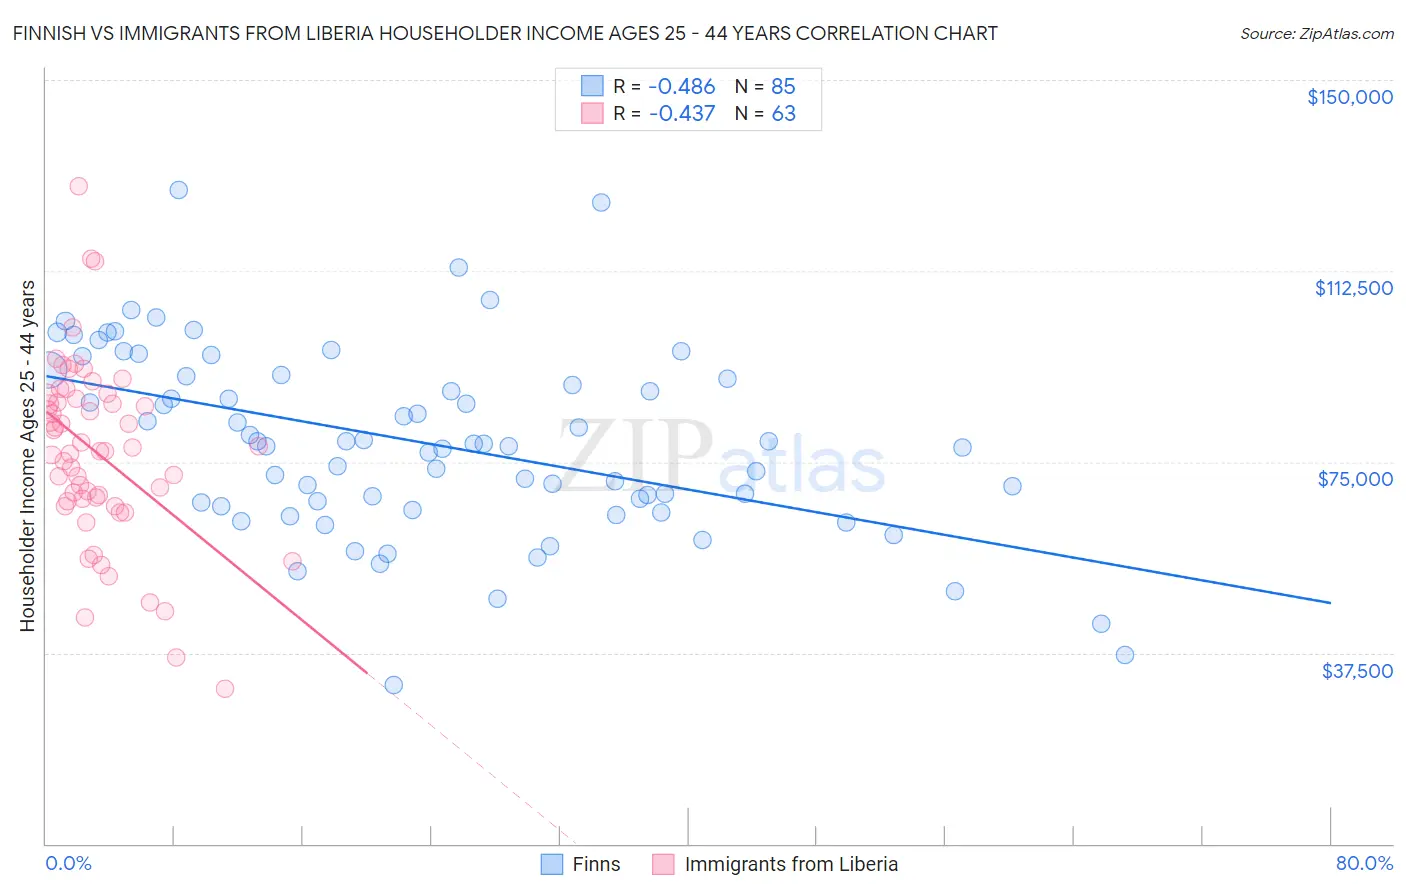
Finnish vs Immigrants from Liberia Householder Income Ages 25 - 44 years Correlation Chart
The statistical analysis conducted on geographies consisting of 403,262,071 people shows a moderate negative correlation between the proportion of Finns and household income with householder between the ages 25 and 44 in the United States with a correlation coefficient (R) of -0.486 and weighted average of $94,610. Similarly, the statistical analysis conducted on geographies consisting of 135,196,849 people shows a moderate negative correlation between the proportion of Immigrants from Liberia and household income with householder between the ages 25 and 44 in the United States with a correlation coefficient (R) of -0.437 and weighted average of $80,863, a difference of 17.0%.
Householder Income Ages 25 - 44 years Correlation Summary
| Measurement | Finnish | Immigrants from Liberia |
| Minimum | $31,250 | $30,517 |
| Maximum | $128,513 | $129,042 |
| Range | $97,263 | $98,525 |
| Mean | $78,807 | $76,665 |
| Median | $78,652 | $77,079 |
| Interquartile 25% (IQ1) | $66,639 | $67,377 |
| Interquartile 75% (IQ3) | $91,884 | $87,370 |
| Interquartile Range (IQR) | $25,244 | $19,994 |
| Standard Deviation (Sample) | $18,378 | $17,857 |
| Standard Deviation (Population) | $18,270 | $17,715 |
Similar Demographics by Householder Income Ages 25 - 44 years
Demographics Similar to Finns by Householder Income Ages 25 - 44 years
In terms of householder income ages 25 - 44 years, the demographic groups most similar to Finns are Scottish ($94,622, a difference of 0.010%), Colombian ($94,565, a difference of 0.050%), English ($94,429, a difference of 0.19%), Immigrants ($94,423, a difference of 0.20%), and Immigrants from Armenia ($94,867, a difference of 0.27%).
| Demographics | Rating | Rank | Householder Income Ages 25 - 44 years |
| Immigrants | Ethiopia | 59.5 /100 | #166 | Average $95,256 |
| Czechoslovakians | 57.0 /100 | #167 | Average $95,070 |
| Alsatians | 56.8 /100 | #168 | Average $95,059 |
| Native Hawaiians | 56.8 /100 | #169 | Average $95,058 |
| Slovaks | 56.4 /100 | #170 | Average $95,032 |
| Immigrants | Armenia | 54.2 /100 | #171 | Average $94,867 |
| Scottish | 50.8 /100 | #172 | Average $94,622 |
| Finns | 50.6 /100 | #173 | Average $94,610 |
| Colombians | 50.0 /100 | #174 | Average $94,565 |
| English | 48.1 /100 | #175 | Average $94,429 |
| Immigrants | Immigrants | 48.0 /100 | #176 | Average $94,423 |
| Belgians | 45.8 /100 | #177 | Average $94,262 |
| Immigrants | South America | 42.8 /100 | #178 | Average $94,042 |
| French Canadians | 38.2 /100 | #179 | Fair $93,694 |
| French | 37.8 /100 | #180 | Fair $93,665 |
Demographics Similar to Immigrants from Liberia by Householder Income Ages 25 - 44 years
In terms of householder income ages 25 - 44 years, the demographic groups most similar to Immigrants from Liberia are Cherokee ($80,843, a difference of 0.020%), Immigrants from Micronesia ($80,544, a difference of 0.40%), Hispanic or Latino ($80,515, a difference of 0.43%), Dominican ($81,229, a difference of 0.45%), and Mexican ($80,427, a difference of 0.54%).
| Demographics | Rating | Rank | Householder Income Ages 25 - 44 years |
| Yaqui | 0.1 /100 | #292 | Tragic $81,656 |
| Blackfeet | 0.1 /100 | #293 | Tragic $81,531 |
| Cubans | 0.1 /100 | #294 | Tragic $81,483 |
| Bangladeshis | 0.1 /100 | #295 | Tragic $81,363 |
| Immigrants | Dominica | 0.1 /100 | #296 | Tragic $81,351 |
| Immigrants | Guatemala | 0.1 /100 | #297 | Tragic $81,341 |
| Dominicans | 0.1 /100 | #298 | Tragic $81,229 |
| Immigrants | Liberia | 0.1 /100 | #299 | Tragic $80,863 |
| Cherokee | 0.0 /100 | #300 | Tragic $80,843 |
| Immigrants | Micronesia | 0.0 /100 | #301 | Tragic $80,544 |
| Hispanics or Latinos | 0.0 /100 | #302 | Tragic $80,515 |
| Mexicans | 0.0 /100 | #303 | Tragic $80,427 |
| Immigrants | Caribbean | 0.0 /100 | #304 | Tragic $80,326 |
| Immigrants | Dominican Republic | 0.0 /100 | #305 | Tragic $80,319 |
| Apache | 0.0 /100 | #306 | Tragic $80,260 |