Mexican American Indian vs Immigrants from South Africa Median Male Earnings
COMPARE
Mexican American Indian
Immigrants from South Africa
Median Male Earnings
Median Male Earnings Comparison
Mexican American Indians
Immigrants from South Africa
$47,990
MEDIAN MALE EARNINGS
0.2/ 100
METRIC RATING
286th/ 347
METRIC RANK
$62,899
MEDIAN MALE EARNINGS
100.0/ 100
METRIC RATING
39th/ 347
METRIC RANK
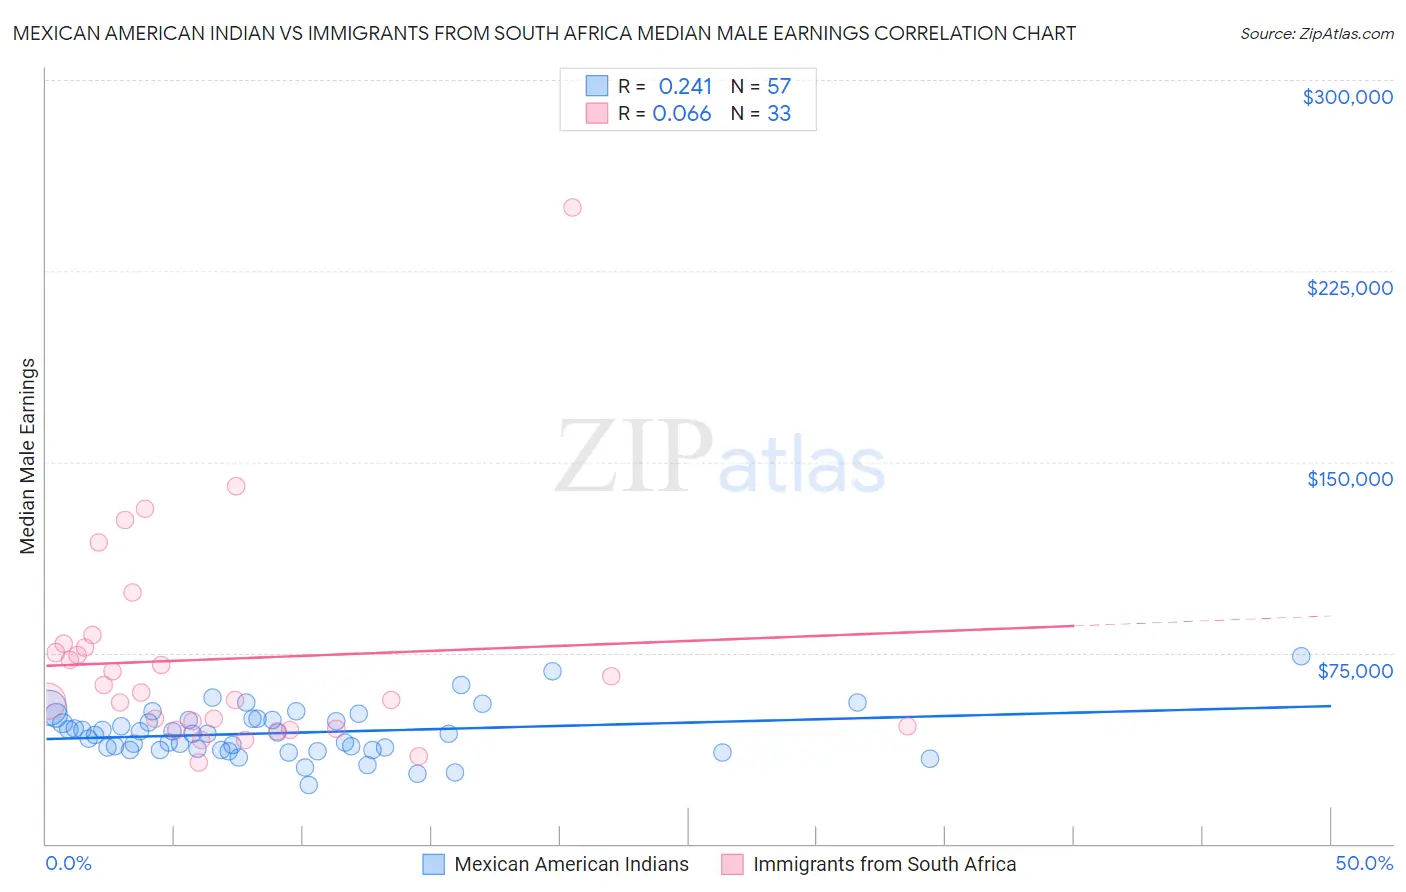
Mexican American Indian vs Immigrants from South Africa Median Male Earnings Correlation Chart
The statistical analysis conducted on geographies consisting of 317,531,084 people shows a weak positive correlation between the proportion of Mexican American Indians and median male earnings in the United States with a correlation coefficient (R) of 0.241 and weighted average of $47,990. Similarly, the statistical analysis conducted on geographies consisting of 233,272,809 people shows a slight positive correlation between the proportion of Immigrants from South Africa and median male earnings in the United States with a correlation coefficient (R) of 0.066 and weighted average of $62,899, a difference of 31.1%.
Median Male Earnings Correlation Summary
| Measurement | Mexican American Indian | Immigrants from South Africa |
| Minimum | $23,167 | $31,875 |
| Maximum | $73,750 | $250,001 |
| Range | $50,583 | $218,126 |
| Mean | $43,547 | $72,583 |
| Median | $43,107 | $59,605 |
| Interquartile 25% (IQ1) | $36,938 | $45,646 |
| Interquartile 75% (IQ3) | $48,895 | $77,820 |
| Interquartile Range (IQR) | $11,957 | $32,174 |
| Standard Deviation (Sample) | $9,541 | $42,392 |
| Standard Deviation (Population) | $9,457 | $41,745 |
Similar Demographics by Median Male Earnings
Demographics Similar to Mexican American Indians by Median Male Earnings
In terms of median male earnings, the demographic groups most similar to Mexican American Indians are Paiute ($47,991, a difference of 0.0%), African ($47,994, a difference of 0.010%), Immigrants from El Salvador ($47,973, a difference of 0.040%), Immigrants from Jamaica ($48,040, a difference of 0.10%), and Shoshone ($47,930, a difference of 0.12%).
| Demographics | Rating | Rank | Median Male Earnings |
| Hmong | 0.2 /100 | #279 | Tragic $48,254 |
| Comanche | 0.2 /100 | #280 | Tragic $48,202 |
| Marshallese | 0.2 /100 | #281 | Tragic $48,137 |
| Central Americans | 0.2 /100 | #282 | Tragic $48,093 |
| Immigrants | Jamaica | 0.2 /100 | #283 | Tragic $48,040 |
| Africans | 0.2 /100 | #284 | Tragic $47,994 |
| Paiute | 0.2 /100 | #285 | Tragic $47,991 |
| Mexican American Indians | 0.2 /100 | #286 | Tragic $47,990 |
| Immigrants | El Salvador | 0.2 /100 | #287 | Tragic $47,973 |
| Shoshone | 0.2 /100 | #288 | Tragic $47,930 |
| Chickasaw | 0.1 /100 | #289 | Tragic $47,832 |
| Immigrants | Belize | 0.1 /100 | #290 | Tragic $47,809 |
| Choctaw | 0.1 /100 | #291 | Tragic $47,729 |
| Immigrants | Dominica | 0.1 /100 | #292 | Tragic $47,651 |
| Indonesians | 0.1 /100 | #293 | Tragic $47,503 |
Demographics Similar to Immigrants from South Africa by Median Male Earnings
In terms of median male earnings, the demographic groups most similar to Immigrants from South Africa are Australian ($62,857, a difference of 0.070%), Maltese ($62,953, a difference of 0.090%), Immigrants from Turkey ($62,728, a difference of 0.27%), Immigrants from Sri Lanka ($63,099, a difference of 0.32%), and Immigrants from Greece ($62,689, a difference of 0.34%).
| Demographics | Rating | Rank | Median Male Earnings |
| Soviet Union | 100.0 /100 | #32 | Exceptional $63,382 |
| Immigrants | Lithuania | 100.0 /100 | #33 | Exceptional $63,346 |
| Immigrants | Russia | 100.0 /100 | #34 | Exceptional $63,326 |
| Immigrants | Asia | 100.0 /100 | #35 | Exceptional $63,240 |
| Israelis | 100.0 /100 | #36 | Exceptional $63,228 |
| Immigrants | Sri Lanka | 100.0 /100 | #37 | Exceptional $63,099 |
| Maltese | 100.0 /100 | #38 | Exceptional $62,953 |
| Immigrants | South Africa | 100.0 /100 | #39 | Exceptional $62,899 |
| Australians | 100.0 /100 | #40 | Exceptional $62,857 |
| Immigrants | Turkey | 100.0 /100 | #41 | Exceptional $62,728 |
| Immigrants | Greece | 100.0 /100 | #42 | Exceptional $62,689 |
| Immigrants | Belarus | 100.0 /100 | #43 | Exceptional $62,658 |
| Cambodians | 100.0 /100 | #44 | Exceptional $62,516 |
| Bulgarians | 100.0 /100 | #45 | Exceptional $62,378 |
| Immigrants | Czechoslovakia | 99.9 /100 | #46 | Exceptional $62,217 |