Puerto Rican vs Immigrants from South Africa Median Male Earnings
COMPARE
Puerto Rican
Immigrants from South Africa
Median Male Earnings
Median Male Earnings Comparison
Puerto Ricans
Immigrants from South Africa
$40,071
MEDIAN MALE EARNINGS
0.0/ 100
METRIC RATING
345th/ 347
METRIC RANK
$62,899
MEDIAN MALE EARNINGS
100.0/ 100
METRIC RATING
39th/ 347
METRIC RANK
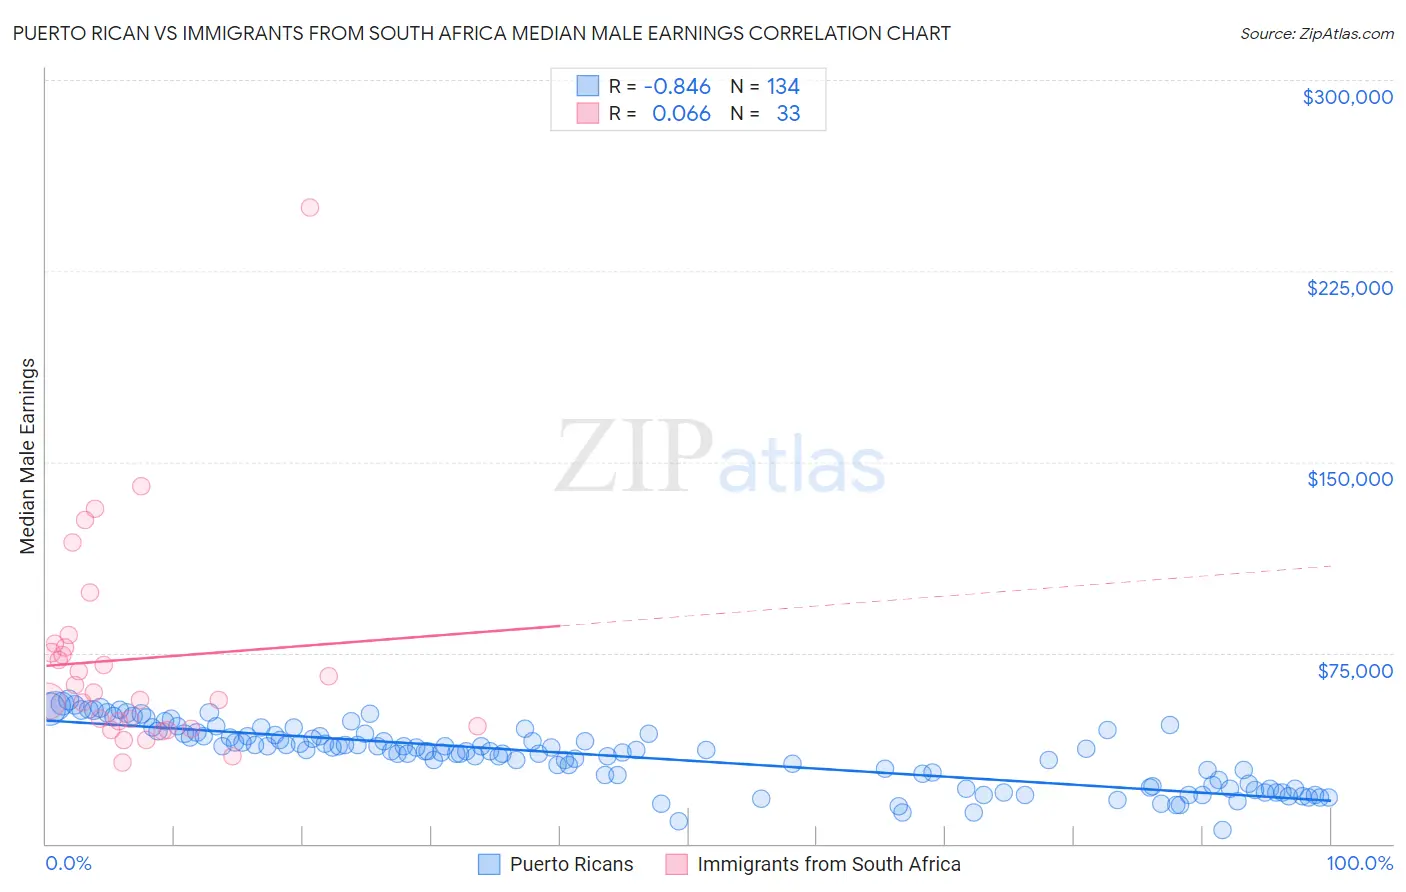
Puerto Rican vs Immigrants from South Africa Median Male Earnings Correlation Chart
The statistical analysis conducted on geographies consisting of 527,834,370 people shows a very strong negative correlation between the proportion of Puerto Ricans and median male earnings in the United States with a correlation coefficient (R) of -0.846 and weighted average of $40,071. Similarly, the statistical analysis conducted on geographies consisting of 233,272,809 people shows a slight positive correlation between the proportion of Immigrants from South Africa and median male earnings in the United States with a correlation coefficient (R) of 0.066 and weighted average of $62,899, a difference of 57.0%.
Median Male Earnings Correlation Summary
| Measurement | Puerto Rican | Immigrants from South Africa |
| Minimum | $5,183 | $31,875 |
| Maximum | $56,414 | $250,001 |
| Range | $51,231 | $218,126 |
| Mean | $34,723 | $72,583 |
| Median | $36,571 | $59,605 |
| Interquartile 25% (IQ1) | $23,294 | $45,646 |
| Interquartile 75% (IQ3) | $43,124 | $77,820 |
| Interquartile Range (IQR) | $19,830 | $32,174 |
| Standard Deviation (Sample) | $11,965 | $42,392 |
| Standard Deviation (Population) | $11,920 | $41,745 |
Similar Demographics by Median Male Earnings
Demographics Similar to Puerto Ricans by Median Male Earnings
In terms of median male earnings, the demographic groups most similar to Puerto Ricans are Tohono O'odham ($39,543, a difference of 1.3%), Yup'ik ($39,504, a difference of 1.4%), Pueblo ($41,314, a difference of 3.1%), Lumbee ($41,715, a difference of 4.1%), and Arapaho ($41,758, a difference of 4.2%).
| Demographics | Rating | Rank | Median Male Earnings |
| Immigrants | Congo | 0.0 /100 | #333 | Tragic $44,204 |
| Immigrants | Yemen | 0.0 /100 | #334 | Tragic $44,083 |
| Spanish American Indians | 0.0 /100 | #335 | Tragic $44,010 |
| Immigrants | Cuba | 0.0 /100 | #336 | Tragic $43,461 |
| Menominee | 0.0 /100 | #337 | Tragic $42,581 |
| Crow | 0.0 /100 | #338 | Tragic $42,434 |
| Pima | 0.0 /100 | #339 | Tragic $42,357 |
| Navajo | 0.0 /100 | #340 | Tragic $42,098 |
| Hopi | 0.0 /100 | #341 | Tragic $42,060 |
| Arapaho | 0.0 /100 | #342 | Tragic $41,758 |
| Lumbee | 0.0 /100 | #343 | Tragic $41,715 |
| Pueblo | 0.0 /100 | #344 | Tragic $41,314 |
| Puerto Ricans | 0.0 /100 | #345 | Tragic $40,071 |
| Tohono O'odham | 0.0 /100 | #346 | Tragic $39,543 |
| Yup'ik | 0.0 /100 | #347 | Tragic $39,504 |
Demographics Similar to Immigrants from South Africa by Median Male Earnings
In terms of median male earnings, the demographic groups most similar to Immigrants from South Africa are Australian ($62,857, a difference of 0.070%), Maltese ($62,953, a difference of 0.090%), Immigrants from Turkey ($62,728, a difference of 0.27%), Immigrants from Sri Lanka ($63,099, a difference of 0.32%), and Immigrants from Greece ($62,689, a difference of 0.34%).
| Demographics | Rating | Rank | Median Male Earnings |
| Soviet Union | 100.0 /100 | #32 | Exceptional $63,382 |
| Immigrants | Lithuania | 100.0 /100 | #33 | Exceptional $63,346 |
| Immigrants | Russia | 100.0 /100 | #34 | Exceptional $63,326 |
| Immigrants | Asia | 100.0 /100 | #35 | Exceptional $63,240 |
| Israelis | 100.0 /100 | #36 | Exceptional $63,228 |
| Immigrants | Sri Lanka | 100.0 /100 | #37 | Exceptional $63,099 |
| Maltese | 100.0 /100 | #38 | Exceptional $62,953 |
| Immigrants | South Africa | 100.0 /100 | #39 | Exceptional $62,899 |
| Australians | 100.0 /100 | #40 | Exceptional $62,857 |
| Immigrants | Turkey | 100.0 /100 | #41 | Exceptional $62,728 |
| Immigrants | Greece | 100.0 /100 | #42 | Exceptional $62,689 |
| Immigrants | Belarus | 100.0 /100 | #43 | Exceptional $62,658 |
| Cambodians | 100.0 /100 | #44 | Exceptional $62,516 |
| Bulgarians | 100.0 /100 | #45 | Exceptional $62,378 |
| Immigrants | Czechoslovakia | 99.9 /100 | #46 | Exceptional $62,217 |