Finnish vs Immigrants from Portugal In Labor Force | Age 45-54
COMPARE
Finnish
Immigrants from Portugal
In Labor Force | Age 45-54
In Labor Force | Age 45-54 Comparison
Finns
Immigrants from Portugal
83.1%
IN LABOR FORCE | AGE 45-54
83.3/ 100
METRIC RATING
131st/ 347
METRIC RANK
82.0%
IN LABOR FORCE | AGE 45-54
1.7/ 100
METRIC RATING
232nd/ 347
METRIC RANK
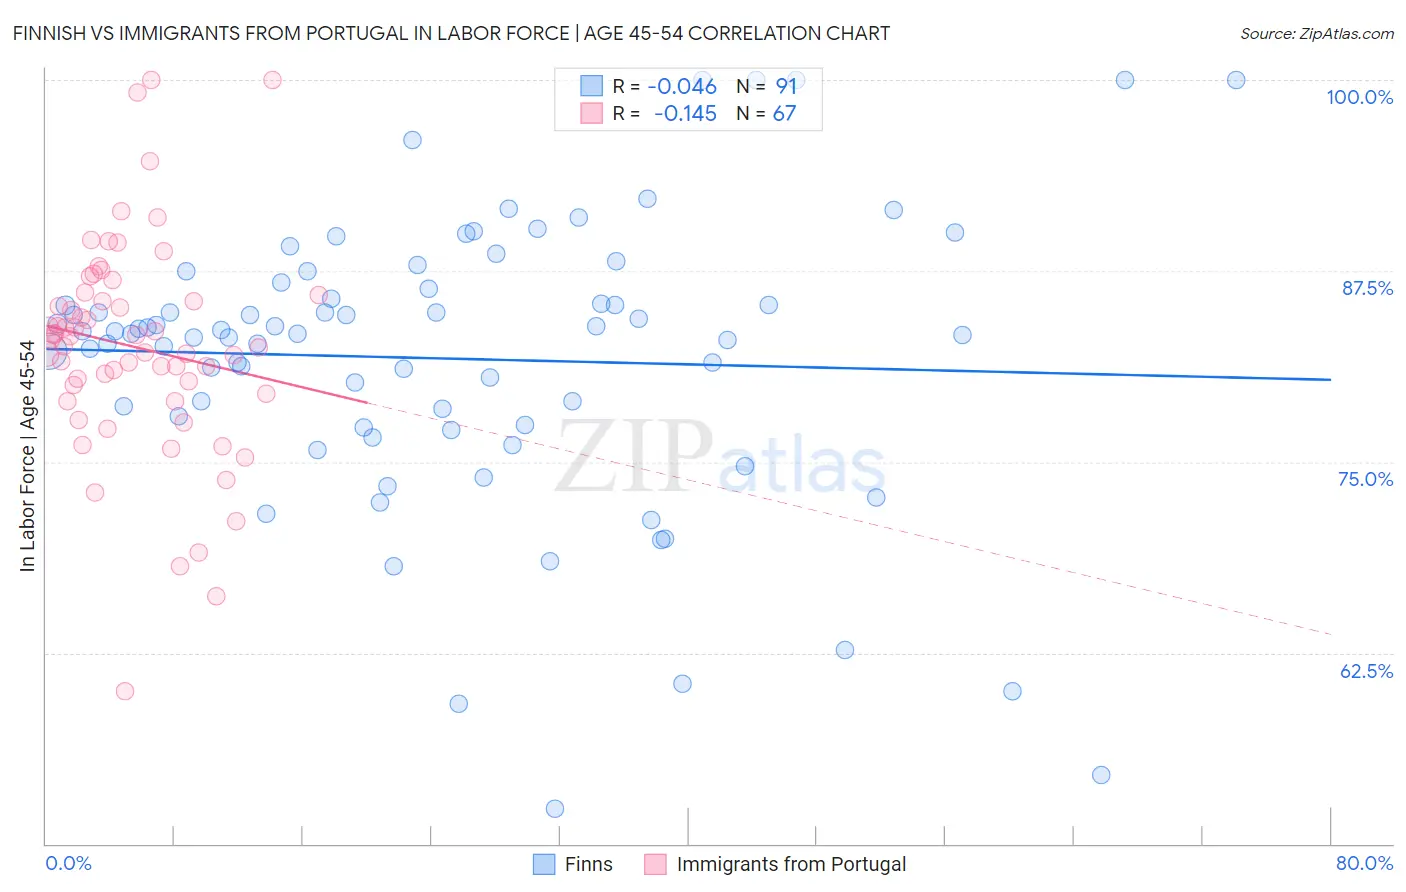
Finnish vs Immigrants from Portugal In Labor Force | Age 45-54 Correlation Chart
The statistical analysis conducted on geographies consisting of 404,469,956 people shows no correlation between the proportion of Finns and labor force participation rate among population between the ages 45 and 54 in the United States with a correlation coefficient (R) of -0.046 and weighted average of 83.1%. Similarly, the statistical analysis conducted on geographies consisting of 174,762,889 people shows a poor negative correlation between the proportion of Immigrants from Portugal and labor force participation rate among population between the ages 45 and 54 in the United States with a correlation coefficient (R) of -0.145 and weighted average of 82.0%, a difference of 1.3%.
In Labor Force | Age 45-54 Correlation Summary
| Measurement | Finnish | Immigrants from Portugal |
| Minimum | 52.3% | 60.0% |
| Maximum | 100.0% | 100.0% |
| Range | 47.7% | 40.0% |
| Mean | 81.8% | 82.5% |
| Median | 83.4% | 83.0% |
| Interquartile 25% (IQ1) | 77.4% | 79.5% |
| Interquartile 75% (IQ3) | 86.4% | 85.9% |
| Interquartile Range (IQR) | 8.9% | 6.4% |
| Standard Deviation (Sample) | 9.4% | 7.1% |
| Standard Deviation (Population) | 9.3% | 7.1% |
Similar Demographics by In Labor Force | Age 45-54
Demographics Similar to Finns by In Labor Force | Age 45-54
In terms of in labor force | age 45-54, the demographic groups most similar to Finns are Immigrants from Ukraine (83.0%, a difference of 0.010%), Liberian (83.0%, a difference of 0.010%), Immigrants from Israel (83.1%, a difference of 0.020%), Sudanese (83.0%, a difference of 0.020%), and Immigrants from Jordan (83.1%, a difference of 0.030%).
| Demographics | Rating | Rank | In Labor Force | Age 45-54 |
| Bermudans | 88.0 /100 | #124 | Excellent 83.1% |
| Immigrants | Iran | 87.2 /100 | #125 | Excellent 83.1% |
| Immigrants | Belgium | 86.4 /100 | #126 | Excellent 83.1% |
| Immigrants | Jordan | 85.2 /100 | #127 | Excellent 83.1% |
| Germans | 85.1 /100 | #128 | Excellent 83.1% |
| Immigrants | Northern Europe | 85.1 /100 | #129 | Excellent 83.1% |
| Immigrants | Israel | 84.7 /100 | #130 | Excellent 83.1% |
| Finns | 83.3 /100 | #131 | Excellent 83.1% |
| Immigrants | Ukraine | 82.9 /100 | #132 | Excellent 83.0% |
| Liberians | 82.7 /100 | #133 | Excellent 83.0% |
| Sudanese | 82.0 /100 | #134 | Excellent 83.0% |
| Austrians | 81.3 /100 | #135 | Excellent 83.0% |
| Immigrants | Kazakhstan | 81.0 /100 | #136 | Excellent 83.0% |
| Immigrants | Spain | 80.4 /100 | #137 | Excellent 83.0% |
| Ghanaians | 79.5 /100 | #138 | Good 83.0% |
Demographics Similar to Immigrants from Portugal by In Labor Force | Age 45-54
In terms of in labor force | age 45-54, the demographic groups most similar to Immigrants from Portugal are Immigrants from Senegal (82.0%, a difference of 0.0%), Malaysian (82.0%, a difference of 0.0%), Salvadoran (82.0%, a difference of 0.0%), Jamaican (82.0%, a difference of 0.020%), and Immigrants from Burma/Myanmar (82.0%, a difference of 0.030%).
| Demographics | Rating | Rank | In Labor Force | Age 45-54 |
| Immigrants | Oceania | 2.5 /100 | #225 | Tragic 82.1% |
| Immigrants | Caribbean | 2.5 /100 | #226 | Tragic 82.1% |
| Immigrants | Germany | 2.4 /100 | #227 | Tragic 82.1% |
| Cape Verdeans | 2.1 /100 | #228 | Tragic 82.1% |
| Immigrants | Burma/Myanmar | 1.9 /100 | #229 | Tragic 82.0% |
| Jamaicans | 1.8 /100 | #230 | Tragic 82.0% |
| Immigrants | Senegal | 1.7 /100 | #231 | Tragic 82.0% |
| Immigrants | Portugal | 1.7 /100 | #232 | Tragic 82.0% |
| Malaysians | 1.7 /100 | #233 | Tragic 82.0% |
| Salvadorans | 1.7 /100 | #234 | Tragic 82.0% |
| Sub-Saharan Africans | 1.2 /100 | #235 | Tragic 82.0% |
| Basques | 1.2 /100 | #236 | Tragic 82.0% |
| Immigrants | Trinidad and Tobago | 1.2 /100 | #237 | Tragic 82.0% |
| Trinidadians and Tobagonians | 1.1 /100 | #238 | Tragic 81.9% |
| Immigrants | Thailand | 1.0 /100 | #239 | Tragic 81.9% |