Uruguayan vs Immigrants from Bahamas Median Family Income
COMPARE
Uruguayan
Immigrants from Bahamas
Median Family Income
Median Family Income Comparison
Uruguayans
Immigrants from Bahamas
$100,656
MEDIAN FAMILY INCOME
26.3/ 100
METRIC RATING
194th/ 347
METRIC RANK
$84,732
MEDIAN FAMILY INCOME
0.0/ 100
METRIC RATING
314th/ 347
METRIC RANK
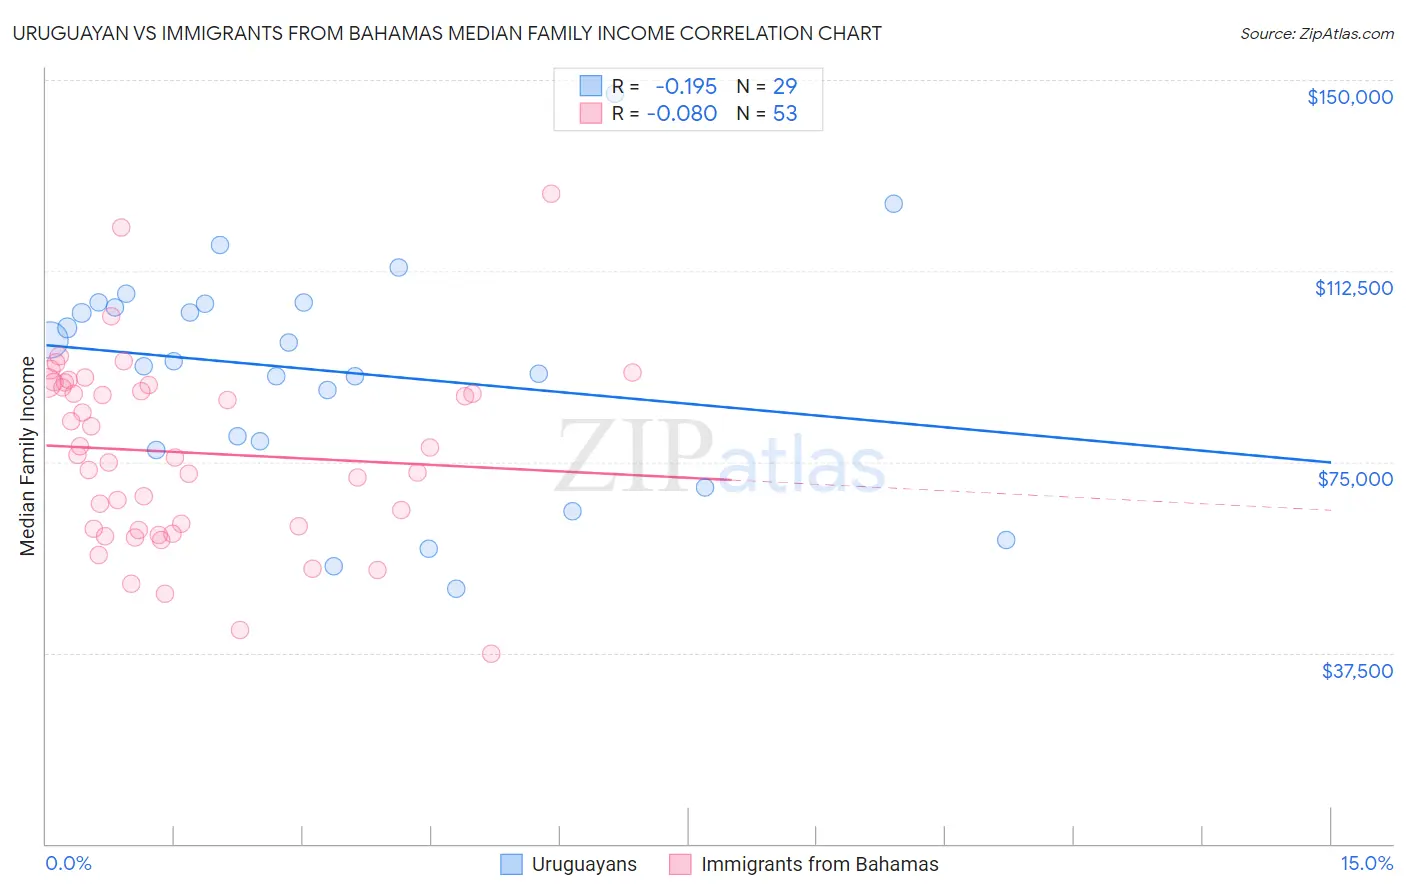
Uruguayan vs Immigrants from Bahamas Median Family Income Correlation Chart
The statistical analysis conducted on geographies consisting of 144,757,564 people shows a poor negative correlation between the proportion of Uruguayans and median family income in the United States with a correlation coefficient (R) of -0.195 and weighted average of $100,656. Similarly, the statistical analysis conducted on geographies consisting of 104,583,914 people shows a slight negative correlation between the proportion of Immigrants from Bahamas and median family income in the United States with a correlation coefficient (R) of -0.080 and weighted average of $84,732, a difference of 18.8%.
Median Family Income Correlation Summary
| Measurement | Uruguayan | Immigrants from Bahamas |
| Minimum | $50,000 | $37,231 |
| Maximum | $147,344 | $127,688 |
| Range | $97,344 | $90,457 |
| Mean | $92,799 | $76,834 |
| Median | $94,724 | $76,465 |
| Interquartile 25% (IQ1) | $78,231 | $61,742 |
| Interquartile 75% (IQ3) | $106,137 | $90,302 |
| Interquartile Range (IQR) | $27,906 | $28,560 |
| Standard Deviation (Sample) | $22,298 | $18,260 |
| Standard Deviation (Population) | $21,910 | $18,087 |
Similar Demographics by Median Family Income
Demographics Similar to Uruguayans by Median Family Income
In terms of median family income, the demographic groups most similar to Uruguayans are Iraqi ($100,658, a difference of 0.0%), Immigrants from Kenya ($100,679, a difference of 0.020%), Colombian ($100,750, a difference of 0.090%), Immigrants from South America ($100,414, a difference of 0.24%), and Immigrants ($100,962, a difference of 0.30%).
| Demographics | Rating | Rank | Median Family Income |
| Tlingit-Haida | 30.8 /100 | #187 | Fair $101,092 |
| Guamanians/Chamorros | 30.5 /100 | #188 | Fair $101,061 |
| Immigrants | Portugal | 29.6 /100 | #189 | Fair $100,984 |
| Immigrants | Immigrants | 29.4 /100 | #190 | Fair $100,962 |
| Colombians | 27.2 /100 | #191 | Fair $100,750 |
| Immigrants | Kenya | 26.5 /100 | #192 | Fair $100,679 |
| Iraqis | 26.3 /100 | #193 | Fair $100,658 |
| Uruguayans | 26.3 /100 | #194 | Fair $100,656 |
| Immigrants | South America | 23.9 /100 | #195 | Fair $100,414 |
| Samoans | 23.3 /100 | #196 | Fair $100,344 |
| Immigrants | Cameroon | 22.8 /100 | #197 | Fair $100,289 |
| Immigrants | Africa | 22.5 /100 | #198 | Fair $100,256 |
| Yugoslavians | 21.3 /100 | #199 | Fair $100,119 |
| Spanish | 20.1 /100 | #200 | Fair $99,977 |
| Immigrants | Thailand | 19.0 /100 | #201 | Poor $99,840 |
Demographics Similar to Immigrants from Bahamas by Median Family Income
In terms of median family income, the demographic groups most similar to Immigrants from Bahamas are Choctaw ($84,835, a difference of 0.12%), Cuban ($84,981, a difference of 0.29%), Honduran ($85,004, a difference of 0.32%), Apache ($84,451, a difference of 0.33%), and Immigrants from Central America ($85,050, a difference of 0.37%).
| Demographics | Rating | Rank | Median Family Income |
| Chickasaw | 0.0 /100 | #307 | Tragic $85,356 |
| U.S. Virgin Islanders | 0.0 /100 | #308 | Tragic $85,294 |
| Haitians | 0.0 /100 | #309 | Tragic $85,218 |
| Immigrants | Central America | 0.0 /100 | #310 | Tragic $85,050 |
| Hondurans | 0.0 /100 | #311 | Tragic $85,004 |
| Cubans | 0.0 /100 | #312 | Tragic $84,981 |
| Choctaw | 0.0 /100 | #313 | Tragic $84,835 |
| Immigrants | Bahamas | 0.0 /100 | #314 | Tragic $84,732 |
| Apache | 0.0 /100 | #315 | Tragic $84,451 |
| Immigrants | Haiti | 0.0 /100 | #316 | Tragic $84,018 |
| Yakama | 0.0 /100 | #317 | Tragic $83,932 |
| Immigrants | Mexico | 0.0 /100 | #318 | Tragic $83,639 |
| Immigrants | Honduras | 0.0 /100 | #319 | Tragic $83,618 |
| Seminole | 0.0 /100 | #320 | Tragic $83,354 |
| Immigrants | Caribbean | 0.0 /100 | #321 | Tragic $83,319 |