Immigrants from England vs Bolivian Median Male Earnings
COMPARE
Immigrants from England
Bolivian
Median Male Earnings
Median Male Earnings Comparison
Immigrants from England
Bolivians
$59,527
MEDIAN MALE EARNINGS
99.3/ 100
METRIC RATING
86th/ 347
METRIC RANK
$61,066
MEDIAN MALE EARNINGS
99.8/ 100
METRIC RATING
61st/ 347
METRIC RANK
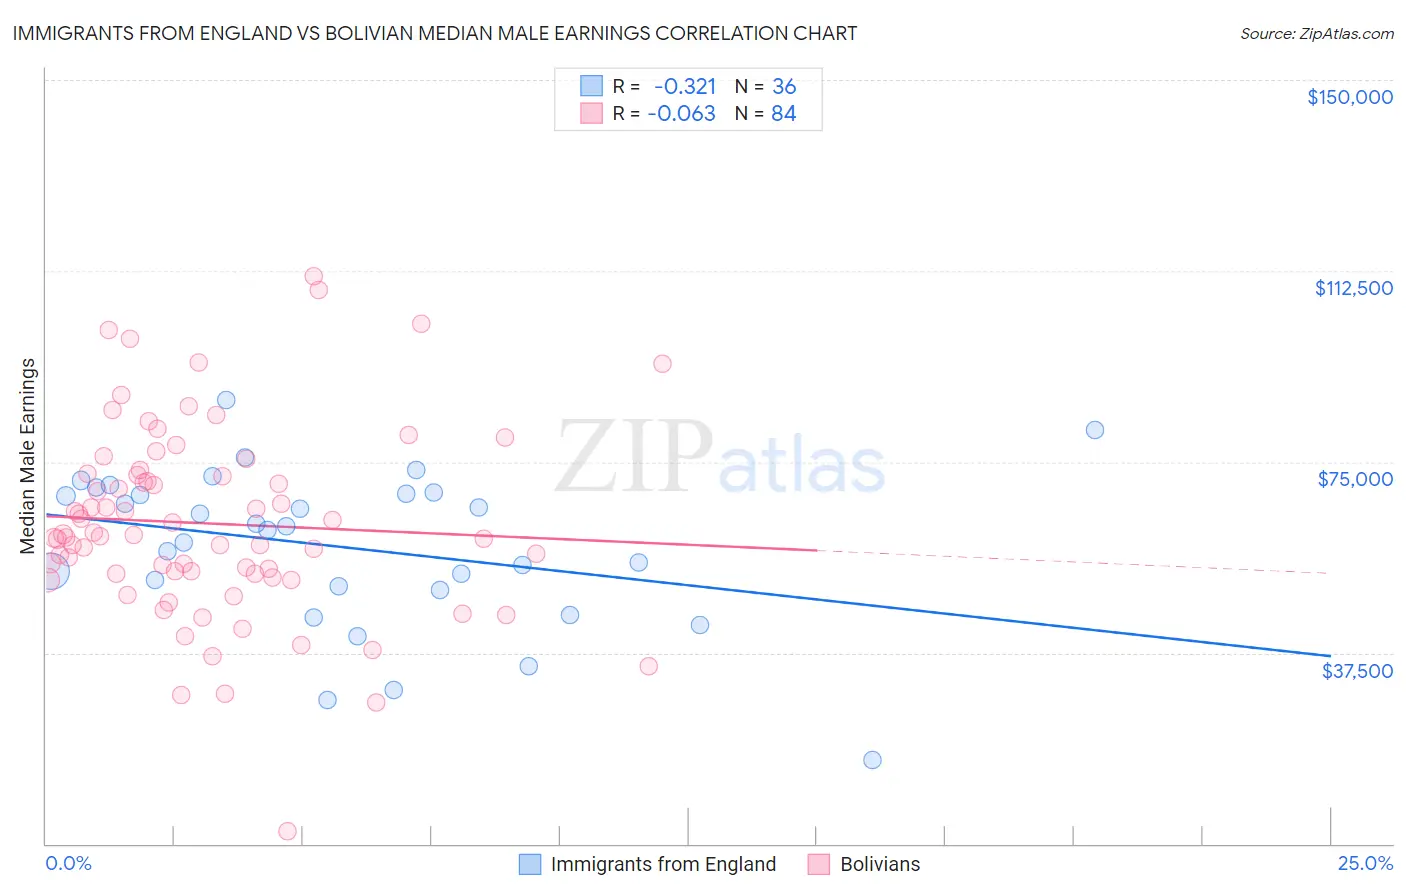
Immigrants from England vs Bolivian Median Male Earnings Correlation Chart
The statistical analysis conducted on geographies consisting of 391,689,688 people shows a mild negative correlation between the proportion of Immigrants from England and median male earnings in the United States with a correlation coefficient (R) of -0.321 and weighted average of $59,527. Similarly, the statistical analysis conducted on geographies consisting of 184,669,287 people shows a slight negative correlation between the proportion of Bolivians and median male earnings in the United States with a correlation coefficient (R) of -0.063 and weighted average of $61,066, a difference of 2.6%.
Median Male Earnings Correlation Summary
| Measurement | Immigrants from England | Bolivian |
| Minimum | $16,326 | $2,499 |
| Maximum | $87,186 | $111,480 |
| Range | $70,860 | $108,981 |
| Mean | $58,179 | $62,895 |
| Median | $62,084 | $60,590 |
| Interquartile 25% (IQ1) | $50,179 | $53,011 |
| Interquartile 75% (IQ3) | $68,837 | $72,615 |
| Interquartile Range (IQR) | $18,658 | $19,604 |
| Standard Deviation (Sample) | $15,499 | $18,921 |
| Standard Deviation (Population) | $15,282 | $18,808 |
Similar Demographics by Median Male Earnings
Demographics Similar to Immigrants from England by Median Male Earnings
In terms of median male earnings, the demographic groups most similar to Immigrants from England are Macedonian ($59,522, a difference of 0.010%), Italian ($59,551, a difference of 0.040%), Afghan ($59,554, a difference of 0.050%), Immigrants from Argentina ($59,491, a difference of 0.060%), and Immigrants from Moldova ($59,417, a difference of 0.18%).
| Demographics | Rating | Rank | Median Male Earnings |
| Immigrants | Ukraine | 99.5 /100 | #79 | Exceptional $59,820 |
| Immigrants | Hungary | 99.5 /100 | #80 | Exceptional $59,806 |
| Ukrainians | 99.4 /100 | #81 | Exceptional $59,728 |
| Croatians | 99.4 /100 | #82 | Exceptional $59,715 |
| Immigrants | Italy | 99.4 /100 | #83 | Exceptional $59,691 |
| Afghans | 99.3 /100 | #84 | Exceptional $59,554 |
| Italians | 99.3 /100 | #85 | Exceptional $59,551 |
| Immigrants | England | 99.3 /100 | #86 | Exceptional $59,527 |
| Macedonians | 99.3 /100 | #87 | Exceptional $59,522 |
| Immigrants | Argentina | 99.3 /100 | #88 | Exceptional $59,491 |
| Immigrants | Moldova | 99.2 /100 | #89 | Exceptional $59,417 |
| Austrians | 99.2 /100 | #90 | Exceptional $59,359 |
| Laotians | 99.2 /100 | #91 | Exceptional $59,351 |
| Immigrants | Kazakhstan | 99.1 /100 | #92 | Exceptional $59,278 |
| Immigrants | Southern Europe | 99.0 /100 | #93 | Exceptional $59,217 |
Demographics Similar to Bolivians by Median Male Earnings
In terms of median male earnings, the demographic groups most similar to Bolivians are Immigrants from Romania ($61,040, a difference of 0.040%), Immigrants from Netherlands ($61,096, a difference of 0.050%), Egyptian ($61,095, a difference of 0.050%), Immigrants from Pakistan ($60,987, a difference of 0.13%), and Immigrants from Eastern Europe ($60,958, a difference of 0.18%).
| Demographics | Rating | Rank | Median Male Earnings |
| Immigrants | Latvia | 99.9 /100 | #54 | Exceptional $61,422 |
| Greeks | 99.9 /100 | #55 | Exceptional $61,242 |
| Lithuanians | 99.9 /100 | #56 | Exceptional $61,228 |
| Immigrants | Scotland | 99.9 /100 | #57 | Exceptional $61,220 |
| New Zealanders | 99.9 /100 | #58 | Exceptional $61,199 |
| Immigrants | Netherlands | 99.8 /100 | #59 | Exceptional $61,096 |
| Egyptians | 99.8 /100 | #60 | Exceptional $61,095 |
| Bolivians | 99.8 /100 | #61 | Exceptional $61,066 |
| Immigrants | Romania | 99.8 /100 | #62 | Exceptional $61,040 |
| Immigrants | Pakistan | 99.8 /100 | #63 | Exceptional $60,987 |
| Immigrants | Eastern Europe | 99.8 /100 | #64 | Exceptional $60,958 |
| Immigrants | Indonesia | 99.8 /100 | #65 | Exceptional $60,935 |
| Immigrants | Croatia | 99.8 /100 | #66 | Exceptional $60,914 |
| Immigrants | Spain | 99.8 /100 | #67 | Exceptional $60,750 |
| Immigrants | Serbia | 99.7 /100 | #68 | Exceptional $60,600 |