Fijian vs Immigrants from Zaire Per Capita Income
COMPARE
Fijian
Immigrants from Zaire
Per Capita Income
Per Capita Income Comparison
Fijians
Immigrants from Zaire
$36,690
PER CAPITA INCOME
0.0/ 100
METRIC RATING
308th/ 347
METRIC RANK
$38,848
PER CAPITA INCOME
0.4/ 100
METRIC RATING
267th/ 347
METRIC RANK
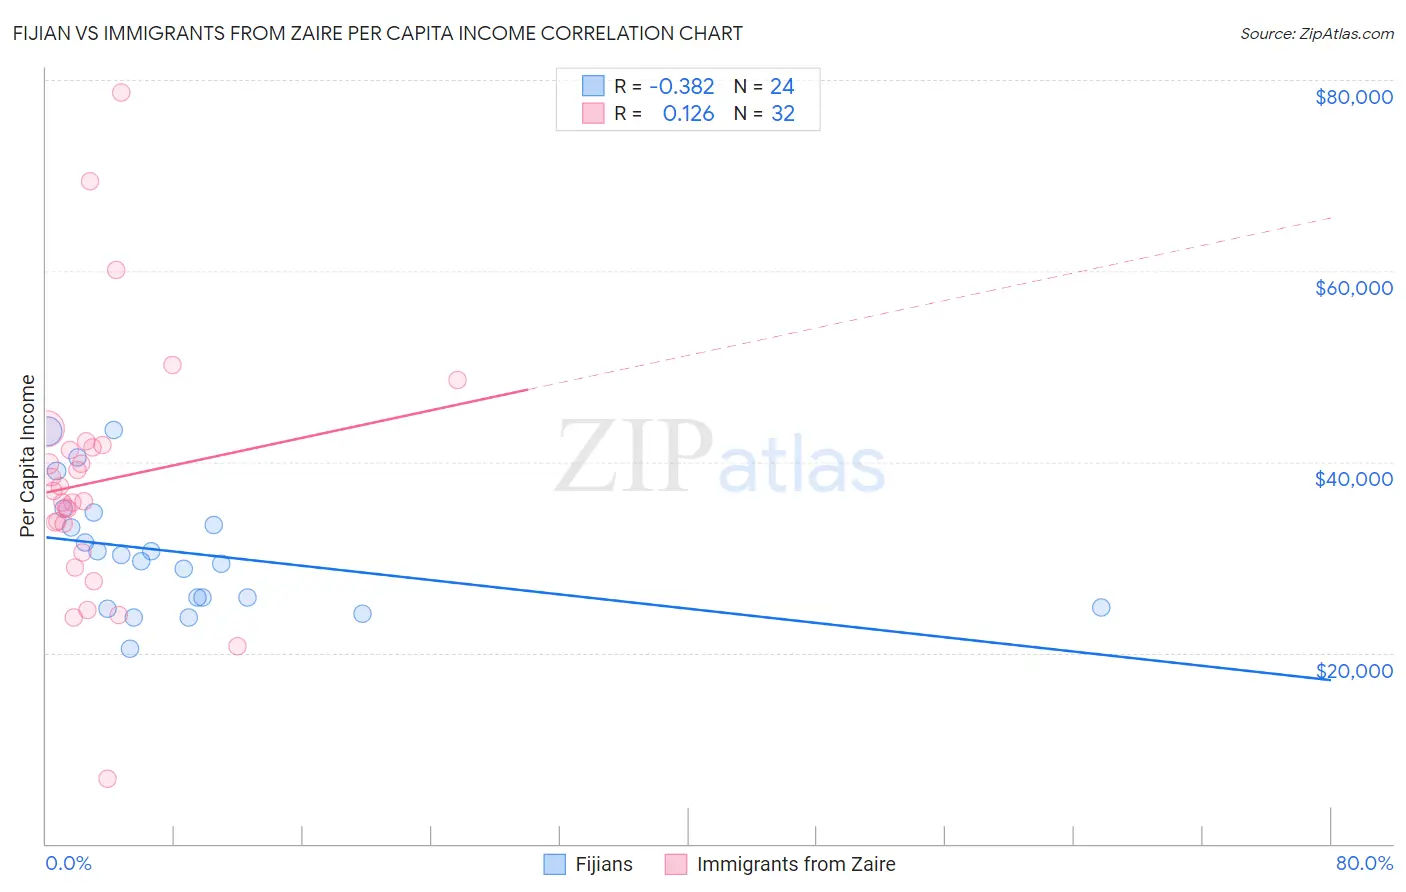
Fijian vs Immigrants from Zaire Per Capita Income Correlation Chart
The statistical analysis conducted on geographies consisting of 55,948,768 people shows a mild negative correlation between the proportion of Fijians and per capita income in the United States with a correlation coefficient (R) of -0.382 and weighted average of $36,690. Similarly, the statistical analysis conducted on geographies consisting of 107,255,805 people shows a poor positive correlation between the proportion of Immigrants from Zaire and per capita income in the United States with a correlation coefficient (R) of 0.126 and weighted average of $38,848, a difference of 5.9%.
Per Capita Income Correlation Summary
| Measurement | Fijian | Immigrants from Zaire |
| Minimum | $20,445 | $6,803 |
| Maximum | $43,340 | $78,629 |
| Range | $22,895 | $71,826 |
| Mean | $30,488 | $37,941 |
| Median | $29,934 | $36,388 |
| Interquartile 25% (IQ1) | $25,226 | $32,029 |
| Interquartile 75% (IQ3) | $34,063 | $41,659 |
| Interquartile Range (IQR) | $8,837 | $9,630 |
| Standard Deviation (Sample) | $6,360 | $13,517 |
| Standard Deviation (Population) | $6,227 | $13,304 |
Similar Demographics by Per Capita Income
Demographics Similar to Fijians by Per Capita Income
In terms of per capita income, the demographic groups most similar to Fijians are Immigrants from Honduras ($36,665, a difference of 0.070%), Ute ($36,651, a difference of 0.10%), Chippewa ($36,631, a difference of 0.16%), Immigrants from Latin America ($36,823, a difference of 0.36%), and Immigrants from Haiti ($36,849, a difference of 0.43%).
| Demographics | Rating | Rank | Per Capita Income |
| Ottawa | 0.1 /100 | #301 | Tragic $37,101 |
| Shoshone | 0.1 /100 | #302 | Tragic $37,072 |
| Paiute | 0.1 /100 | #303 | Tragic $37,066 |
| Hondurans | 0.1 /100 | #304 | Tragic $37,031 |
| Inupiat | 0.1 /100 | #305 | Tragic $36,999 |
| Immigrants | Haiti | 0.0 /100 | #306 | Tragic $36,849 |
| Immigrants | Latin America | 0.0 /100 | #307 | Tragic $36,823 |
| Fijians | 0.0 /100 | #308 | Tragic $36,690 |
| Immigrants | Honduras | 0.0 /100 | #309 | Tragic $36,665 |
| Ute | 0.0 /100 | #310 | Tragic $36,651 |
| Chippewa | 0.0 /100 | #311 | Tragic $36,631 |
| Chickasaw | 0.0 /100 | #312 | Tragic $36,475 |
| Bahamians | 0.0 /100 | #313 | Tragic $36,427 |
| Seminole | 0.0 /100 | #314 | Tragic $36,180 |
| Yaqui | 0.0 /100 | #315 | Tragic $36,112 |
Demographics Similar to Immigrants from Zaire by Per Capita Income
In terms of per capita income, the demographic groups most similar to Immigrants from Zaire are Salvadoran ($38,858, a difference of 0.030%), Liberian ($38,780, a difference of 0.17%), Immigrants from Jamaica ($38,766, a difference of 0.21%), Spanish American ($39,012, a difference of 0.42%), and American ($39,039, a difference of 0.49%).
| Demographics | Rating | Rank | Per Capita Income |
| Alaskan Athabascans | 0.6 /100 | #260 | Tragic $39,163 |
| Marshallese | 0.6 /100 | #261 | Tragic $39,108 |
| Iroquois | 0.6 /100 | #262 | Tragic $39,104 |
| Belizeans | 0.6 /100 | #263 | Tragic $39,097 |
| Americans | 0.6 /100 | #264 | Tragic $39,039 |
| Spanish Americans | 0.5 /100 | #265 | Tragic $39,012 |
| Salvadorans | 0.5 /100 | #266 | Tragic $38,858 |
| Immigrants | Zaire | 0.4 /100 | #267 | Tragic $38,848 |
| Liberians | 0.4 /100 | #268 | Tragic $38,780 |
| Immigrants | Jamaica | 0.4 /100 | #269 | Tragic $38,766 |
| Immigrants | Belize | 0.3 /100 | #270 | Tragic $38,614 |
| Central Americans | 0.3 /100 | #271 | Tragic $38,560 |
| Immigrants | Cabo Verde | 0.3 /100 | #272 | Tragic $38,540 |
| Nepalese | 0.3 /100 | #273 | Tragic $38,442 |
| Immigrants | El Salvador | 0.3 /100 | #274 | Tragic $38,394 |