Vietnamese vs Immigrants from Fiji Householder Income Ages 45 - 64 years
COMPARE
Vietnamese
Immigrants from Fiji
Householder Income Ages 45 - 64 years
Householder Income Ages 45 - 64 years Comparison
Vietnamese
Immigrants from Fiji
$93,788
HOUSEHOLDER INCOME AGES 45 - 64 YEARS
3.6/ 100
METRIC RATING
229th/ 347
METRIC RANK
$106,952
HOUSEHOLDER INCOME AGES 45 - 64 YEARS
96.5/ 100
METRIC RATING
107th/ 347
METRIC RANK
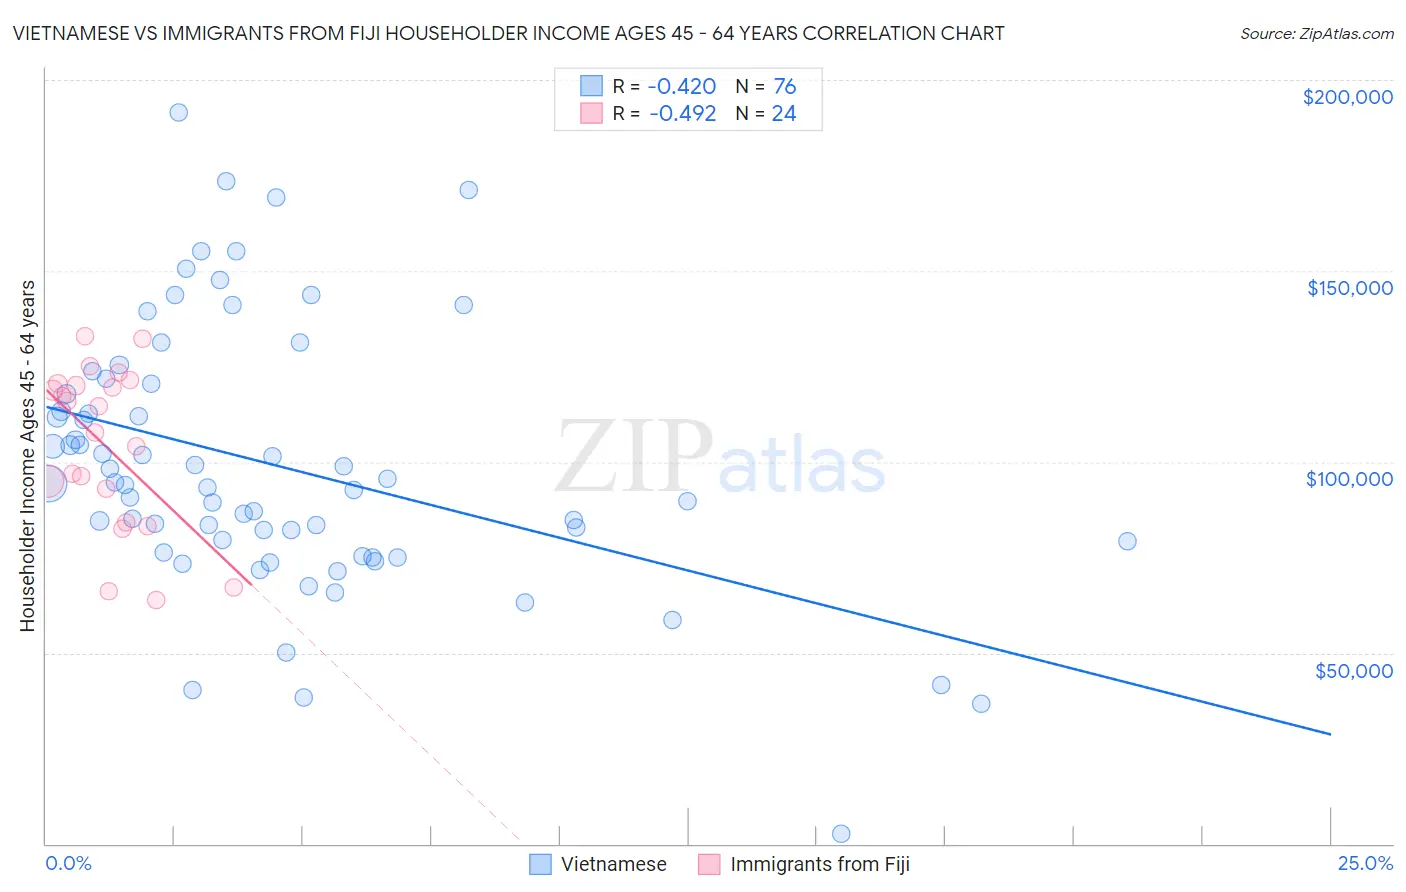
Vietnamese vs Immigrants from Fiji Householder Income Ages 45 - 64 years Correlation Chart
The statistical analysis conducted on geographies consisting of 170,554,464 people shows a moderate negative correlation between the proportion of Vietnamese and household income with householder between the ages 45 and 64 in the United States with a correlation coefficient (R) of -0.420 and weighted average of $93,788. Similarly, the statistical analysis conducted on geographies consisting of 93,744,178 people shows a moderate negative correlation between the proportion of Immigrants from Fiji and household income with householder between the ages 45 and 64 in the United States with a correlation coefficient (R) of -0.492 and weighted average of $106,952, a difference of 14.0%.
Householder Income Ages 45 - 64 years Correlation Summary
| Measurement | Vietnamese | Immigrants from Fiji |
| Minimum | $2,499 | $63,895 |
| Maximum | $191,429 | $132,819 |
| Range | $188,930 | $68,924 |
| Mean | $99,011 | $104,214 |
| Median | $94,156 | $111,173 |
| Interquartile 25% (IQ1) | $77,796 | $88,582 |
| Interquartile 75% (IQ3) | $119,213 | $120,299 |
| Interquartile Range (IQR) | $41,417 | $31,717 |
| Standard Deviation (Sample) | $34,793 | $21,039 |
| Standard Deviation (Population) | $34,563 | $20,596 |
Similar Demographics by Householder Income Ages 45 - 64 years
Demographics Similar to Vietnamese by Householder Income Ages 45 - 64 years
In terms of householder income ages 45 - 64 years, the demographic groups most similar to Vietnamese are Immigrants from Sudan ($93,781, a difference of 0.010%), Immigrants from Panama ($93,815, a difference of 0.030%), Ecuadorian ($93,739, a difference of 0.050%), Sudanese ($93,718, a difference of 0.070%), and Alaska Native ($93,991, a difference of 0.22%).
| Demographics | Rating | Rank | Householder Income Ages 45 - 64 years |
| Malaysians | 5.2 /100 | #222 | Tragic $94,517 |
| Immigrants | Nonimmigrants | 5.0 /100 | #223 | Tragic $94,448 |
| Immigrants | Bosnia and Herzegovina | 4.6 /100 | #224 | Tragic $94,288 |
| Bermudans | 4.4 /100 | #225 | Tragic $94,197 |
| Immigrants | Azores | 4.3 /100 | #226 | Tragic $94,138 |
| Alaska Natives | 4.0 /100 | #227 | Tragic $93,991 |
| Immigrants | Panama | 3.7 /100 | #228 | Tragic $93,815 |
| Vietnamese | 3.6 /100 | #229 | Tragic $93,788 |
| Immigrants | Sudan | 3.6 /100 | #230 | Tragic $93,781 |
| Ecuadorians | 3.6 /100 | #231 | Tragic $93,739 |
| Sudanese | 3.5 /100 | #232 | Tragic $93,718 |
| Nepalese | 3.0 /100 | #233 | Tragic $93,355 |
| Immigrants | El Salvador | 2.7 /100 | #234 | Tragic $93,176 |
| Nicaraguans | 2.0 /100 | #235 | Tragic $92,554 |
| Immigrants | Western Africa | 1.8 /100 | #236 | Tragic $92,384 |
Demographics Similar to Immigrants from Fiji by Householder Income Ages 45 - 64 years
In terms of householder income ages 45 - 64 years, the demographic groups most similar to Immigrants from Fiji are Armenian ($107,002, a difference of 0.050%), Zimbabwean ($106,849, a difference of 0.10%), Macedonian ($107,074, a difference of 0.11%), Immigrants from Ukraine ($107,079, a difference of 0.12%), and Syrian ($107,207, a difference of 0.24%).
| Demographics | Rating | Rank | Householder Income Ages 45 - 64 years |
| Immigrants | Serbia | 97.4 /100 | #100 | Exceptional $107,569 |
| Immigrants | Kazakhstan | 97.2 /100 | #101 | Exceptional $107,378 |
| Immigrants | Moldova | 97.1 /100 | #102 | Exceptional $107,357 |
| Syrians | 96.9 /100 | #103 | Exceptional $107,207 |
| Immigrants | Ukraine | 96.7 /100 | #104 | Exceptional $107,079 |
| Macedonians | 96.7 /100 | #105 | Exceptional $107,074 |
| Armenians | 96.6 /100 | #106 | Exceptional $107,002 |
| Immigrants | Fiji | 96.5 /100 | #107 | Exceptional $106,952 |
| Zimbabweans | 96.3 /100 | #108 | Exceptional $106,849 |
| Chileans | 95.9 /100 | #109 | Exceptional $106,611 |
| Immigrants | Brazil | 95.6 /100 | #110 | Exceptional $106,470 |
| Immigrants | Vietnam | 95.5 /100 | #111 | Exceptional $106,417 |
| Swedes | 95.4 /100 | #112 | Exceptional $106,377 |
| Europeans | 95.4 /100 | #113 | Exceptional $106,367 |
| Immigrants | Poland | 95.3 /100 | #114 | Exceptional $106,319 |