Filipino vs Immigrants from Latin America Householder Income Ages 45 - 64 years
COMPARE
Filipino
Immigrants from Latin America
Householder Income Ages 45 - 64 years
Householder Income Ages 45 - 64 years Comparison
Filipinos
Immigrants from Latin America
$134,910
HOUSEHOLDER INCOME AGES 45 - 64 YEARS
100.0/ 100
METRIC RATING
2nd/ 347
METRIC RANK
$87,219
HOUSEHOLDER INCOME AGES 45 - 64 YEARS
0.1/ 100
METRIC RATING
276th/ 347
METRIC RANK
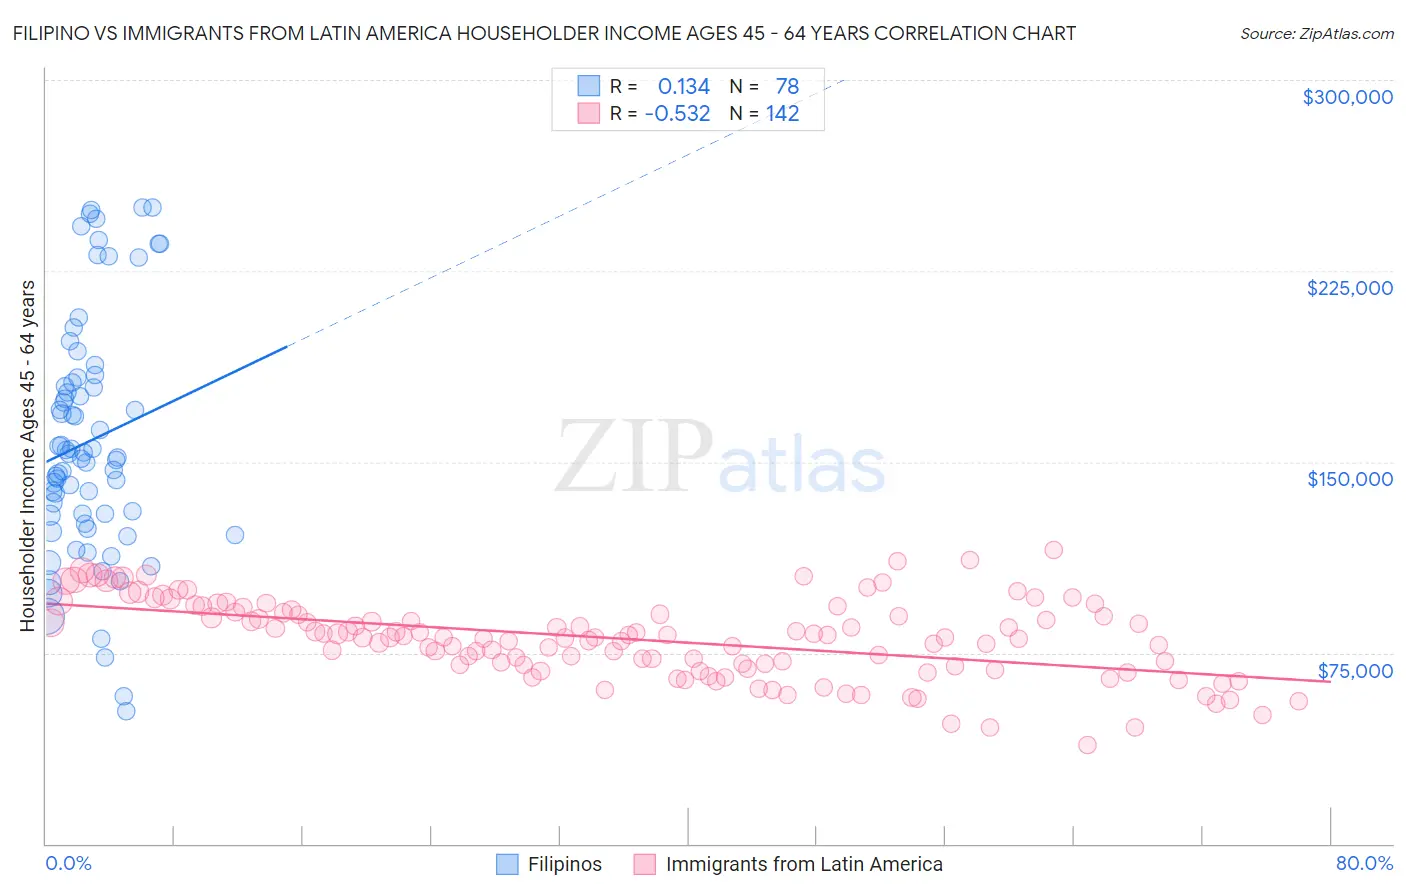
Filipino vs Immigrants from Latin America Householder Income Ages 45 - 64 years Correlation Chart
The statistical analysis conducted on geographies consisting of 254,006,751 people shows a poor positive correlation between the proportion of Filipinos and household income with householder between the ages 45 and 64 in the United States with a correlation coefficient (R) of 0.134 and weighted average of $134,910. Similarly, the statistical analysis conducted on geographies consisting of 555,418,501 people shows a substantial negative correlation between the proportion of Immigrants from Latin America and household income with householder between the ages 45 and 64 in the United States with a correlation coefficient (R) of -0.532 and weighted average of $87,219, a difference of 54.7%.
Householder Income Ages 45 - 64 years Correlation Summary
| Measurement | Filipino | Immigrants from Latin America |
| Minimum | $51,856 | $38,838 |
| Maximum | $250,001 | $115,549 |
| Range | $198,145 | $76,711 |
| Mean | $158,185 | $80,477 |
| Median | $152,545 | $81,005 |
| Interquartile 25% (IQ1) | $128,904 | $70,093 |
| Interquartile 75% (IQ3) | $181,123 | $90,998 |
| Interquartile Range (IQR) | $52,219 | $20,906 |
| Standard Deviation (Sample) | $46,977 | $15,402 |
| Standard Deviation (Population) | $46,675 | $15,348 |
Similar Demographics by Householder Income Ages 45 - 64 years
Demographics Similar to Filipinos by Householder Income Ages 45 - 64 years
In terms of householder income ages 45 - 64 years, the demographic groups most similar to Filipinos are Immigrants from Taiwan ($135,508, a difference of 0.44%), Immigrants from India ($132,488, a difference of 1.8%), Thai ($129,560, a difference of 4.1%), Immigrants from Singapore ($129,514, a difference of 4.2%), and Iranian ($129,350, a difference of 4.3%).
| Demographics | Rating | Rank | Householder Income Ages 45 - 64 years |
| Immigrants | Taiwan | 100.0 /100 | #1 | Exceptional $135,508 |
| Filipinos | 100.0 /100 | #2 | Exceptional $134,910 |
| Immigrants | India | 100.0 /100 | #3 | Exceptional $132,488 |
| Thais | 100.0 /100 | #4 | Exceptional $129,560 |
| Immigrants | Singapore | 100.0 /100 | #5 | Exceptional $129,514 |
| Iranians | 100.0 /100 | #6 | Exceptional $129,350 |
| Immigrants | Hong Kong | 100.0 /100 | #7 | Exceptional $127,500 |
| Immigrants | Iran | 100.0 /100 | #8 | Exceptional $126,940 |
| Okinawans | 100.0 /100 | #9 | Exceptional $124,796 |
| Immigrants | South Central Asia | 100.0 /100 | #10 | Exceptional $124,188 |
| Cypriots | 100.0 /100 | #11 | Exceptional $123,396 |
| Immigrants | Israel | 100.0 /100 | #12 | Exceptional $122,893 |
| Immigrants | Ireland | 100.0 /100 | #13 | Exceptional $122,757 |
| Indians (Asian) | 100.0 /100 | #14 | Exceptional $122,343 |
| Immigrants | Eastern Asia | 100.0 /100 | #15 | Exceptional $122,222 |
Demographics Similar to Immigrants from Latin America by Householder Income Ages 45 - 64 years
In terms of householder income ages 45 - 64 years, the demographic groups most similar to Immigrants from Latin America are Immigrants from Belize ($87,229, a difference of 0.010%), Iroquois ($87,255, a difference of 0.040%), Cree ($87,185, a difference of 0.040%), Immigrants from Jamaica ($87,035, a difference of 0.21%), and Yakama ($86,992, a difference of 0.26%).
| Demographics | Rating | Rank | Householder Income Ages 45 - 64 years |
| Spanish Americans | 0.2 /100 | #269 | Tragic $87,836 |
| Immigrants | Liberia | 0.2 /100 | #270 | Tragic $87,739 |
| Guatemalans | 0.2 /100 | #271 | Tragic $87,705 |
| Cape Verdeans | 0.2 /100 | #272 | Tragic $87,580 |
| Spanish American Indians | 0.2 /100 | #273 | Tragic $87,561 |
| Iroquois | 0.1 /100 | #274 | Tragic $87,255 |
| Immigrants | Belize | 0.1 /100 | #275 | Tragic $87,229 |
| Immigrants | Latin America | 0.1 /100 | #276 | Tragic $87,219 |
| Cree | 0.1 /100 | #277 | Tragic $87,185 |
| Immigrants | Jamaica | 0.1 /100 | #278 | Tragic $87,035 |
| Yakama | 0.1 /100 | #279 | Tragic $86,992 |
| Immigrants | Somalia | 0.1 /100 | #280 | Tragic $86,987 |
| Yaqui | 0.1 /100 | #281 | Tragic $86,914 |
| Senegalese | 0.1 /100 | #282 | Tragic $86,897 |
| Mexicans | 0.1 /100 | #283 | Tragic $86,816 |