Immigrants from Caribbean vs Immigrants from Fiji Householder Income Ages 45 - 64 years
COMPARE
Immigrants from Caribbean
Immigrants from Fiji
Householder Income Ages 45 - 64 years
Householder Income Ages 45 - 64 years Comparison
Immigrants from Caribbean
Immigrants from Fiji
$82,513
HOUSEHOLDER INCOME AGES 45 - 64 YEARS
0.0/ 100
METRIC RATING
316th/ 347
METRIC RANK
$106,952
HOUSEHOLDER INCOME AGES 45 - 64 YEARS
96.5/ 100
METRIC RATING
107th/ 347
METRIC RANK
Immigrants from Caribbean vs Immigrants from Fiji Householder Income Ages 45 - 64 years Correlation Chart
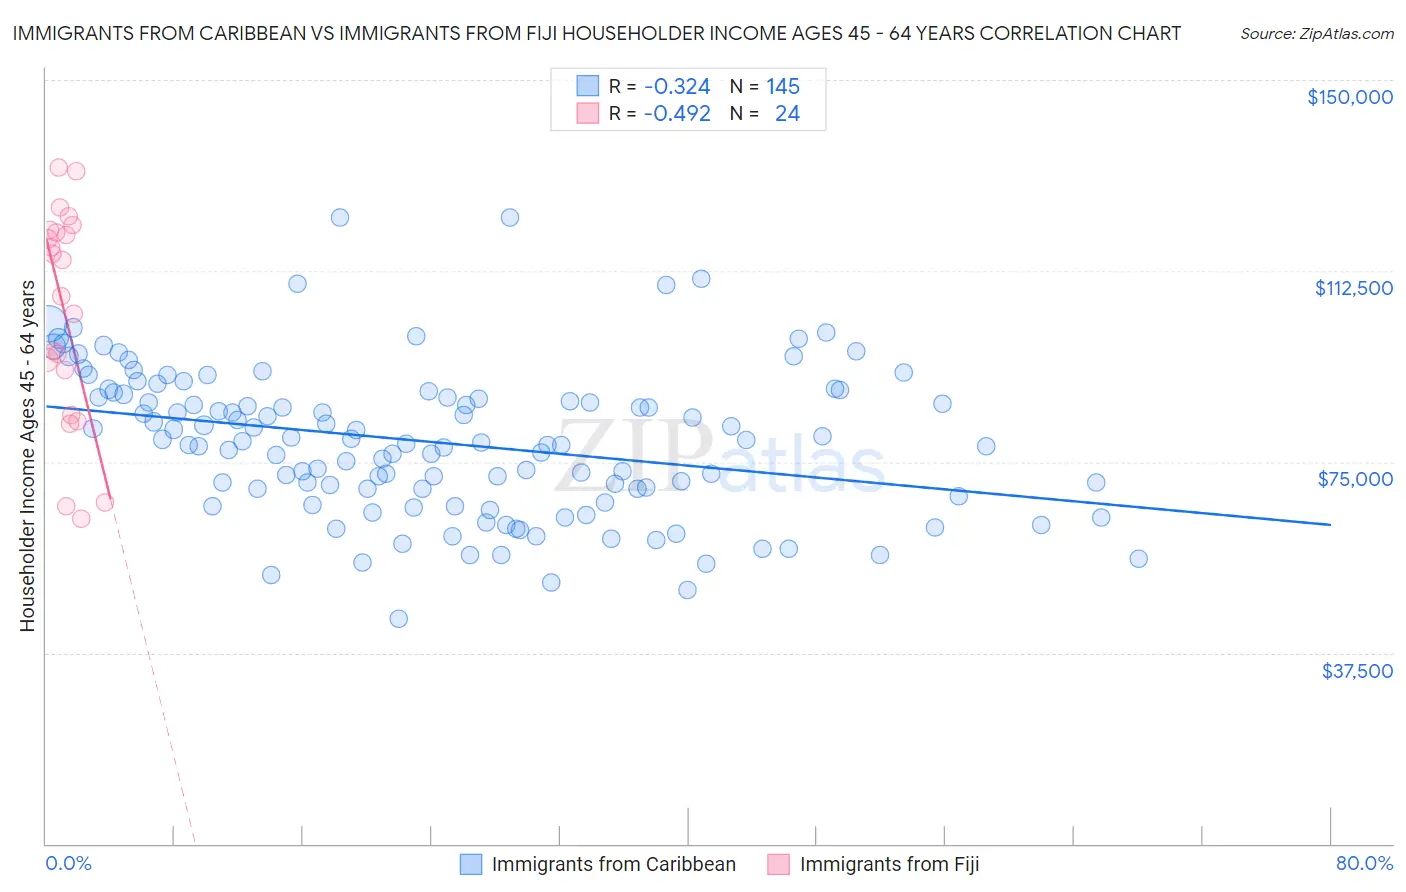
The statistical analysis conducted on geographies consisting of 448,858,846 people shows a mild negative correlation between the proportion of Immigrants from Caribbean and household income with householder between the ages 45 and 64 in the United States with a correlation coefficient (R) of -0.324 and weighted average of $82,513. Similarly, the statistical analysis conducted on geographies consisting of 93,744,178 people shows a moderate negative correlation between the proportion of Immigrants from Fiji and household income with householder between the ages 45 and 64 in the United States with a correlation coefficient (R) of -0.492 and weighted average of $106,952, a difference of 29.6%.
Householder Income Ages 45 - 64 years Correlation Summary
| Measurement | Immigrants from Caribbean | Immigrants from Fiji |
| Minimum | $44,090 | $63,895 |
| Maximum | $123,114 | $132,819 |
| Range | $79,024 | $68,924 |
| Mean | $78,796 | $104,214 |
| Median | $78,921 | $111,173 |
| Interquartile 25% (IQ1) | $68,886 | $88,582 |
| Interquartile 75% (IQ3) | $87,999 | $120,299 |
| Interquartile Range (IQR) | $19,113 | $31,717 |
| Standard Deviation (Sample) | $14,588 | $21,039 |
| Standard Deviation (Population) | $14,538 | $20,596 |
Similar Demographics by Householder Income Ages 45 - 64 years
Demographics Similar to Immigrants from Caribbean by Householder Income Ages 45 - 64 years
In terms of householder income ages 45 - 64 years, the demographic groups most similar to Immigrants from Caribbean are Colville ($82,474, a difference of 0.050%), Paiute ($82,629, a difference of 0.14%), Immigrants from Honduras ($82,697, a difference of 0.22%), U.S. Virgin Islander ($82,736, a difference of 0.27%), and Choctaw ($82,287, a difference of 0.28%).
| Demographics | Rating | Rank | Householder Income Ages 45 - 64 years |
| Immigrants | Dominica | 0.0 /100 | #309 | Tragic $83,311 |
| Immigrants | Haiti | 0.0 /100 | #310 | Tragic $83,257 |
| Immigrants | Bahamas | 0.0 /100 | #311 | Tragic $83,177 |
| Cajuns | 0.0 /100 | #312 | Tragic $83,015 |
| U.S. Virgin Islanders | 0.0 /100 | #313 | Tragic $82,736 |
| Immigrants | Honduras | 0.0 /100 | #314 | Tragic $82,697 |
| Paiute | 0.0 /100 | #315 | Tragic $82,629 |
| Immigrants | Caribbean | 0.0 /100 | #316 | Tragic $82,513 |
| Colville | 0.0 /100 | #317 | Tragic $82,474 |
| Choctaw | 0.0 /100 | #318 | Tragic $82,287 |
| Chickasaw | 0.0 /100 | #319 | Tragic $82,193 |
| Apache | 0.0 /100 | #320 | Tragic $82,184 |
| Yuman | 0.0 /100 | #321 | Tragic $82,139 |
| Sioux | 0.0 /100 | #322 | Tragic $81,750 |
| Bahamians | 0.0 /100 | #323 | Tragic $81,369 |
Demographics Similar to Immigrants from Fiji by Householder Income Ages 45 - 64 years
In terms of householder income ages 45 - 64 years, the demographic groups most similar to Immigrants from Fiji are Armenian ($107,002, a difference of 0.050%), Zimbabwean ($106,849, a difference of 0.10%), Macedonian ($107,074, a difference of 0.11%), Immigrants from Ukraine ($107,079, a difference of 0.12%), and Syrian ($107,207, a difference of 0.24%).
| Demographics | Rating | Rank | Householder Income Ages 45 - 64 years |
| Immigrants | Serbia | 97.4 /100 | #100 | Exceptional $107,569 |
| Immigrants | Kazakhstan | 97.2 /100 | #101 | Exceptional $107,378 |
| Immigrants | Moldova | 97.1 /100 | #102 | Exceptional $107,357 |
| Syrians | 96.9 /100 | #103 | Exceptional $107,207 |
| Immigrants | Ukraine | 96.7 /100 | #104 | Exceptional $107,079 |
| Macedonians | 96.7 /100 | #105 | Exceptional $107,074 |
| Armenians | 96.6 /100 | #106 | Exceptional $107,002 |
| Immigrants | Fiji | 96.5 /100 | #107 | Exceptional $106,952 |
| Zimbabweans | 96.3 /100 | #108 | Exceptional $106,849 |
| Chileans | 95.9 /100 | #109 | Exceptional $106,611 |
| Immigrants | Brazil | 95.6 /100 | #110 | Exceptional $106,470 |
| Immigrants | Vietnam | 95.5 /100 | #111 | Exceptional $106,417 |
| Swedes | 95.4 /100 | #112 | Exceptional $106,377 |
| Europeans | 95.4 /100 | #113 | Exceptional $106,367 |
| Immigrants | Poland | 95.3 /100 | #114 | Exceptional $106,319 |