Filipino vs Icelander Householder Income Ages 45 - 64 years
COMPARE
Filipino
Icelander
Householder Income Ages 45 - 64 years
Householder Income Ages 45 - 64 years Comparison
Filipinos
Icelanders
$134,910
HOUSEHOLDER INCOME AGES 45 - 64 YEARS
100.0/ 100
METRIC RATING
2nd/ 347
METRIC RANK
$102,261
HOUSEHOLDER INCOME AGES 45 - 64 YEARS
72.5/ 100
METRIC RATING
160th/ 347
METRIC RANK
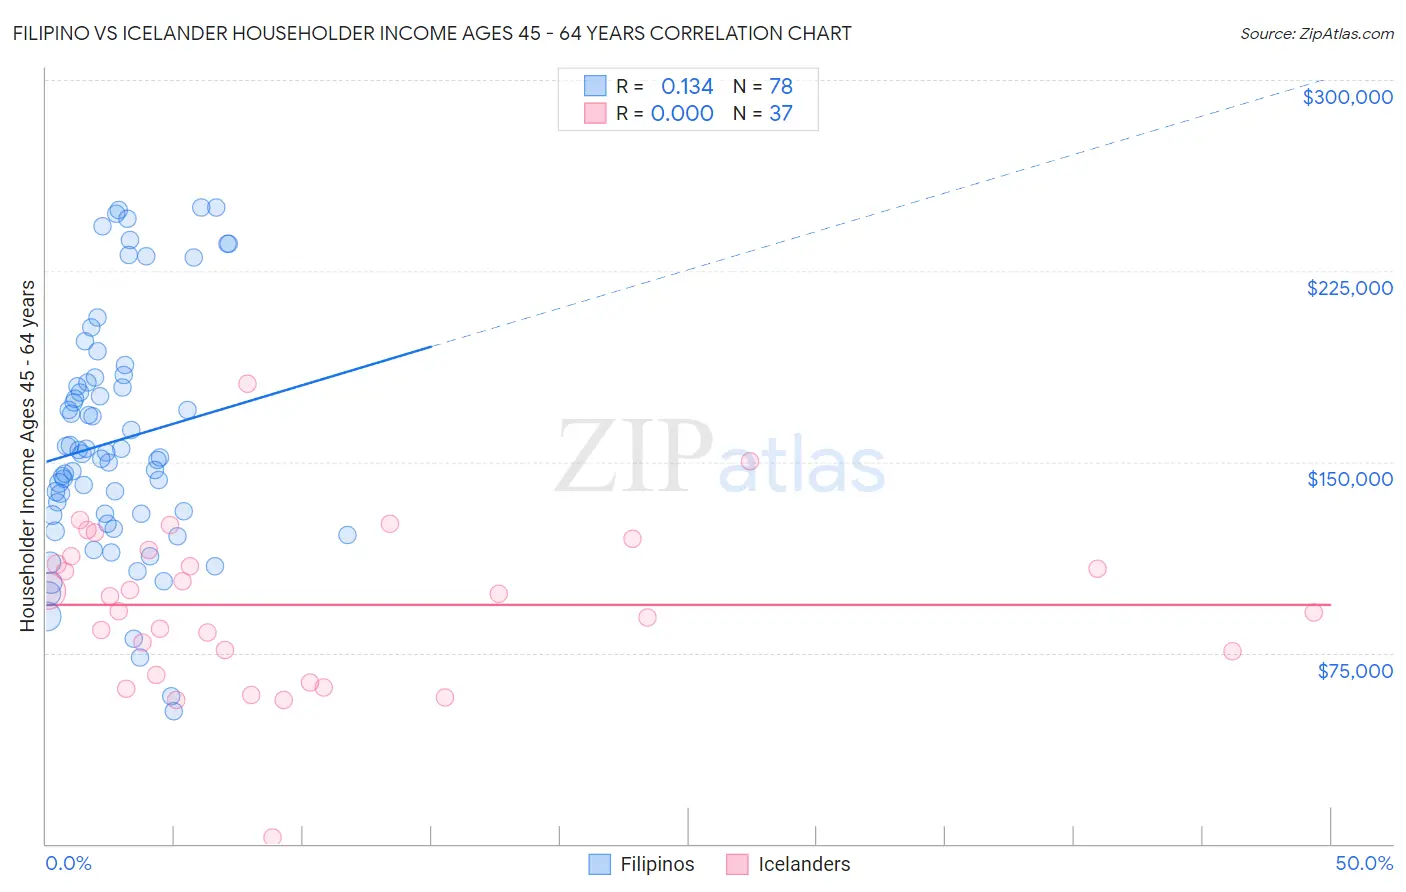
Filipino vs Icelander Householder Income Ages 45 - 64 years Correlation Chart
The statistical analysis conducted on geographies consisting of 254,006,751 people shows a poor positive correlation between the proportion of Filipinos and household income with householder between the ages 45 and 64 in the United States with a correlation coefficient (R) of 0.134 and weighted average of $134,910. Similarly, the statistical analysis conducted on geographies consisting of 159,562,808 people shows no correlation between the proportion of Icelanders and household income with householder between the ages 45 and 64 in the United States with a correlation coefficient (R) of 0.000 and weighted average of $102,261, a difference of 31.9%.
Householder Income Ages 45 - 64 years Correlation Summary
| Measurement | Filipino | Icelander |
| Minimum | $51,856 | $2,499 |
| Maximum | $250,001 | $180,868 |
| Range | $198,145 | $178,369 |
| Mean | $158,185 | $93,816 |
| Median | $152,545 | $97,265 |
| Interquartile 25% (IQ1) | $128,904 | $70,912 |
| Interquartile 75% (IQ3) | $181,123 | $114,136 |
| Interquartile Range (IQR) | $52,219 | $43,224 |
| Standard Deviation (Sample) | $46,977 | $32,005 |
| Standard Deviation (Population) | $46,675 | $31,569 |
Similar Demographics by Householder Income Ages 45 - 64 years
Demographics Similar to Filipinos by Householder Income Ages 45 - 64 years
In terms of householder income ages 45 - 64 years, the demographic groups most similar to Filipinos are Immigrants from Taiwan ($135,508, a difference of 0.44%), Immigrants from India ($132,488, a difference of 1.8%), Thai ($129,560, a difference of 4.1%), Immigrants from Singapore ($129,514, a difference of 4.2%), and Iranian ($129,350, a difference of 4.3%).
| Demographics | Rating | Rank | Householder Income Ages 45 - 64 years |
| Immigrants | Taiwan | 100.0 /100 | #1 | Exceptional $135,508 |
| Filipinos | 100.0 /100 | #2 | Exceptional $134,910 |
| Immigrants | India | 100.0 /100 | #3 | Exceptional $132,488 |
| Thais | 100.0 /100 | #4 | Exceptional $129,560 |
| Immigrants | Singapore | 100.0 /100 | #5 | Exceptional $129,514 |
| Iranians | 100.0 /100 | #6 | Exceptional $129,350 |
| Immigrants | Hong Kong | 100.0 /100 | #7 | Exceptional $127,500 |
| Immigrants | Iran | 100.0 /100 | #8 | Exceptional $126,940 |
| Okinawans | 100.0 /100 | #9 | Exceptional $124,796 |
| Immigrants | South Central Asia | 100.0 /100 | #10 | Exceptional $124,188 |
| Cypriots | 100.0 /100 | #11 | Exceptional $123,396 |
| Immigrants | Israel | 100.0 /100 | #12 | Exceptional $122,893 |
| Immigrants | Ireland | 100.0 /100 | #13 | Exceptional $122,757 |
| Indians (Asian) | 100.0 /100 | #14 | Exceptional $122,343 |
| Immigrants | Eastern Asia | 100.0 /100 | #15 | Exceptional $122,222 |
Demographics Similar to Icelanders by Householder Income Ages 45 - 64 years
In terms of householder income ages 45 - 64 years, the demographic groups most similar to Icelanders are Immigrants from Nepal ($102,190, a difference of 0.070%), Scottish ($102,123, a difference of 0.14%), Sierra Leonean ($102,427, a difference of 0.16%), English ($102,021, a difference of 0.24%), and Immigrants from Morocco ($102,015, a difference of 0.24%).
| Demographics | Rating | Rank | Householder Income Ages 45 - 64 years |
| Scandinavians | 79.0 /100 | #153 | Good $102,969 |
| Slovenes | 78.3 /100 | #154 | Good $102,885 |
| Costa Ricans | 77.4 /100 | #155 | Good $102,779 |
| Carpatho Rusyns | 77.4 /100 | #156 | Good $102,777 |
| Immigrants | Ethiopia | 77.3 /100 | #157 | Good $102,763 |
| Slavs | 76.1 /100 | #158 | Good $102,629 |
| Sierra Leoneans | 74.2 /100 | #159 | Good $102,427 |
| Icelanders | 72.5 /100 | #160 | Good $102,261 |
| Immigrants | Nepal | 71.8 /100 | #161 | Good $102,190 |
| Scottish | 71.1 /100 | #162 | Good $102,123 |
| English | 70.1 /100 | #163 | Good $102,021 |
| Immigrants | Morocco | 70.0 /100 | #164 | Good $102,015 |
| Immigrants | Albania | 69.4 /100 | #165 | Good $101,957 |
| Samoans | 65.3 /100 | #166 | Good $101,580 |
| Czechoslovakians | 63.0 /100 | #167 | Good $101,387 |