Immigrants from Lithuania vs Immigrants from Fiji Householder Income Ages 45 - 64 years
COMPARE
Immigrants from Lithuania
Immigrants from Fiji
Householder Income Ages 45 - 64 years
Householder Income Ages 45 - 64 years Comparison
Immigrants from Lithuania
Immigrants from Fiji
$114,336
HOUSEHOLDER INCOME AGES 45 - 64 YEARS
99.9/ 100
METRIC RATING
41st/ 347
METRIC RANK
$106,952
HOUSEHOLDER INCOME AGES 45 - 64 YEARS
96.5/ 100
METRIC RATING
107th/ 347
METRIC RANK
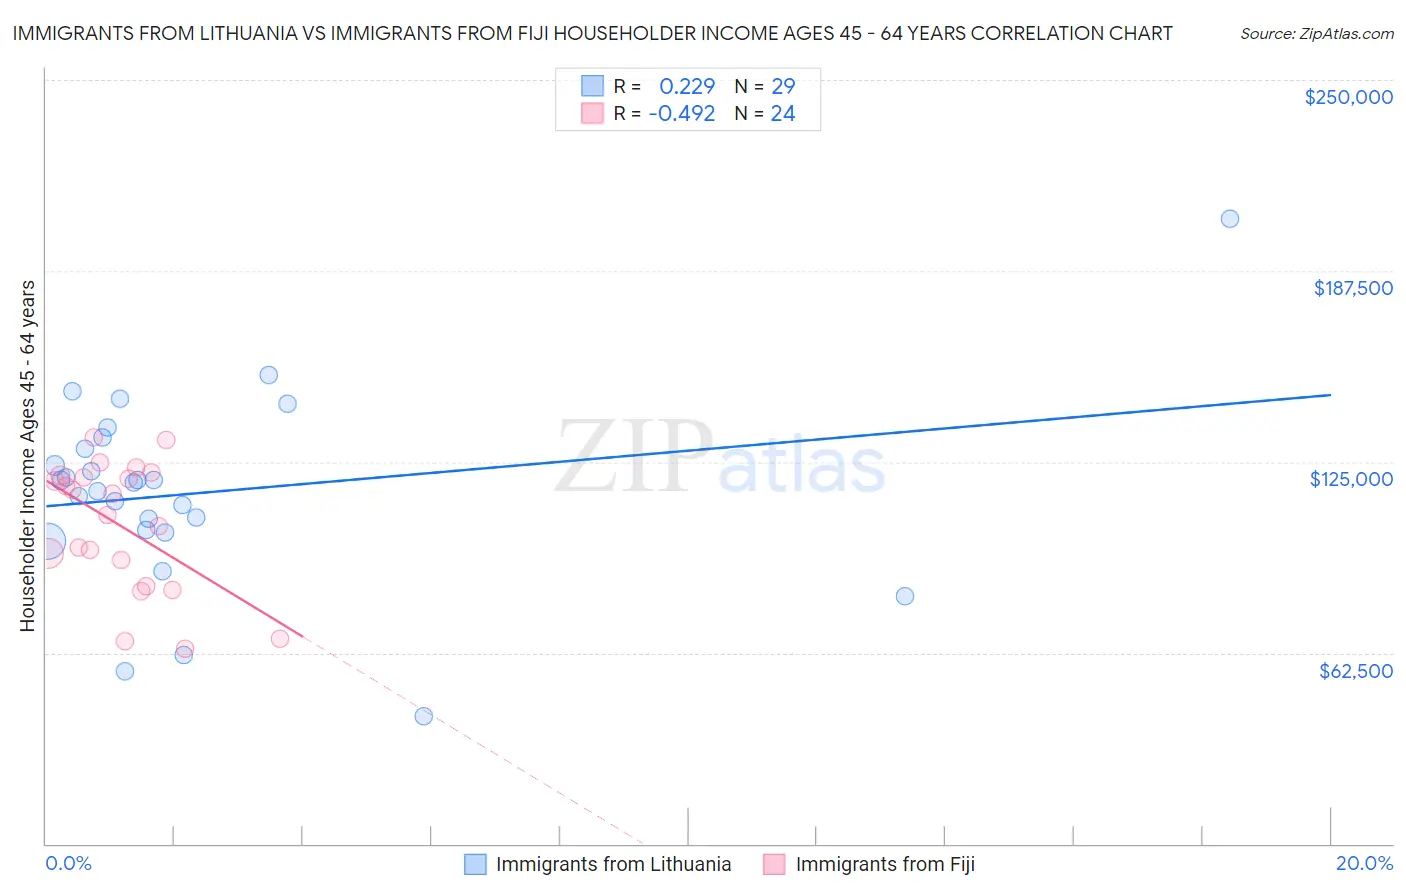
Immigrants from Lithuania vs Immigrants from Fiji Householder Income Ages 45 - 64 years Correlation Chart
The statistical analysis conducted on geographies consisting of 117,696,258 people shows a weak positive correlation between the proportion of Immigrants from Lithuania and household income with householder between the ages 45 and 64 in the United States with a correlation coefficient (R) of 0.229 and weighted average of $114,336. Similarly, the statistical analysis conducted on geographies consisting of 93,744,178 people shows a moderate negative correlation between the proportion of Immigrants from Fiji and household income with householder between the ages 45 and 64 in the United States with a correlation coefficient (R) of -0.492 and weighted average of $106,952, a difference of 6.9%.
Householder Income Ages 45 - 64 years Correlation Summary
| Measurement | Immigrants from Lithuania | Immigrants from Fiji |
| Minimum | $41,667 | $63,895 |
| Maximum | $204,500 | $132,819 |
| Range | $162,833 | $68,924 |
| Mean | $114,986 | $104,214 |
| Median | $118,271 | $111,173 |
| Interquartile 25% (IQ1) | $102,220 | $88,582 |
| Interquartile 75% (IQ3) | $131,130 | $120,299 |
| Interquartile Range (IQR) | $28,910 | $31,717 |
| Standard Deviation (Sample) | $31,501 | $21,039 |
| Standard Deviation (Population) | $30,953 | $20,596 |
Similar Demographics by Householder Income Ages 45 - 64 years
Demographics Similar to Immigrants from Lithuania by Householder Income Ages 45 - 64 years
In terms of householder income ages 45 - 64 years, the demographic groups most similar to Immigrants from Lithuania are Cambodian ($114,342, a difference of 0.010%), Immigrants from Turkey ($114,407, a difference of 0.060%), Immigrants from Pakistan ($114,434, a difference of 0.090%), Estonian ($114,220, a difference of 0.10%), and Israeli ($114,186, a difference of 0.13%).
| Demographics | Rating | Rank | Householder Income Ages 45 - 64 years |
| Immigrants | Denmark | 100.0 /100 | #34 | Exceptional $116,000 |
| Latvians | 100.0 /100 | #35 | Exceptional $115,957 |
| Immigrants | Switzerland | 100.0 /100 | #36 | Exceptional $115,934 |
| Maltese | 99.9 /100 | #37 | Exceptional $114,754 |
| Immigrants | Pakistan | 99.9 /100 | #38 | Exceptional $114,434 |
| Immigrants | Turkey | 99.9 /100 | #39 | Exceptional $114,407 |
| Cambodians | 99.9 /100 | #40 | Exceptional $114,342 |
| Immigrants | Lithuania | 99.9 /100 | #41 | Exceptional $114,336 |
| Estonians | 99.9 /100 | #42 | Exceptional $114,220 |
| Israelis | 99.9 /100 | #43 | Exceptional $114,186 |
| Bulgarians | 99.9 /100 | #44 | Exceptional $113,883 |
| Immigrants | France | 99.9 /100 | #45 | Exceptional $113,680 |
| Immigrants | Greece | 99.9 /100 | #46 | Exceptional $113,548 |
| Australians | 99.9 /100 | #47 | Exceptional $113,533 |
| Immigrants | Indonesia | 99.9 /100 | #48 | Exceptional $113,519 |
Demographics Similar to Immigrants from Fiji by Householder Income Ages 45 - 64 years
In terms of householder income ages 45 - 64 years, the demographic groups most similar to Immigrants from Fiji are Armenian ($107,002, a difference of 0.050%), Zimbabwean ($106,849, a difference of 0.10%), Macedonian ($107,074, a difference of 0.11%), Immigrants from Ukraine ($107,079, a difference of 0.12%), and Syrian ($107,207, a difference of 0.24%).
| Demographics | Rating | Rank | Householder Income Ages 45 - 64 years |
| Immigrants | Serbia | 97.4 /100 | #100 | Exceptional $107,569 |
| Immigrants | Kazakhstan | 97.2 /100 | #101 | Exceptional $107,378 |
| Immigrants | Moldova | 97.1 /100 | #102 | Exceptional $107,357 |
| Syrians | 96.9 /100 | #103 | Exceptional $107,207 |
| Immigrants | Ukraine | 96.7 /100 | #104 | Exceptional $107,079 |
| Macedonians | 96.7 /100 | #105 | Exceptional $107,074 |
| Armenians | 96.6 /100 | #106 | Exceptional $107,002 |
| Immigrants | Fiji | 96.5 /100 | #107 | Exceptional $106,952 |
| Zimbabweans | 96.3 /100 | #108 | Exceptional $106,849 |
| Chileans | 95.9 /100 | #109 | Exceptional $106,611 |
| Immigrants | Brazil | 95.6 /100 | #110 | Exceptional $106,470 |
| Immigrants | Vietnam | 95.5 /100 | #111 | Exceptional $106,417 |
| Swedes | 95.4 /100 | #112 | Exceptional $106,377 |
| Europeans | 95.4 /100 | #113 | Exceptional $106,367 |
| Immigrants | Poland | 95.3 /100 | #114 | Exceptional $106,319 |