Immigrants from the Azores vs Brazilian Per Capita Income
COMPARE
Immigrants from the Azores
Brazilian
Per Capita Income
Per Capita Income Comparison
Immigrants from the Azores
Brazilians
$39,608
PER CAPITA INCOME
1.0/ 100
METRIC RATING
252nd/ 347
METRIC RANK
$46,700
PER CAPITA INCOME
96.8/ 100
METRIC RATING
104th/ 347
METRIC RANK
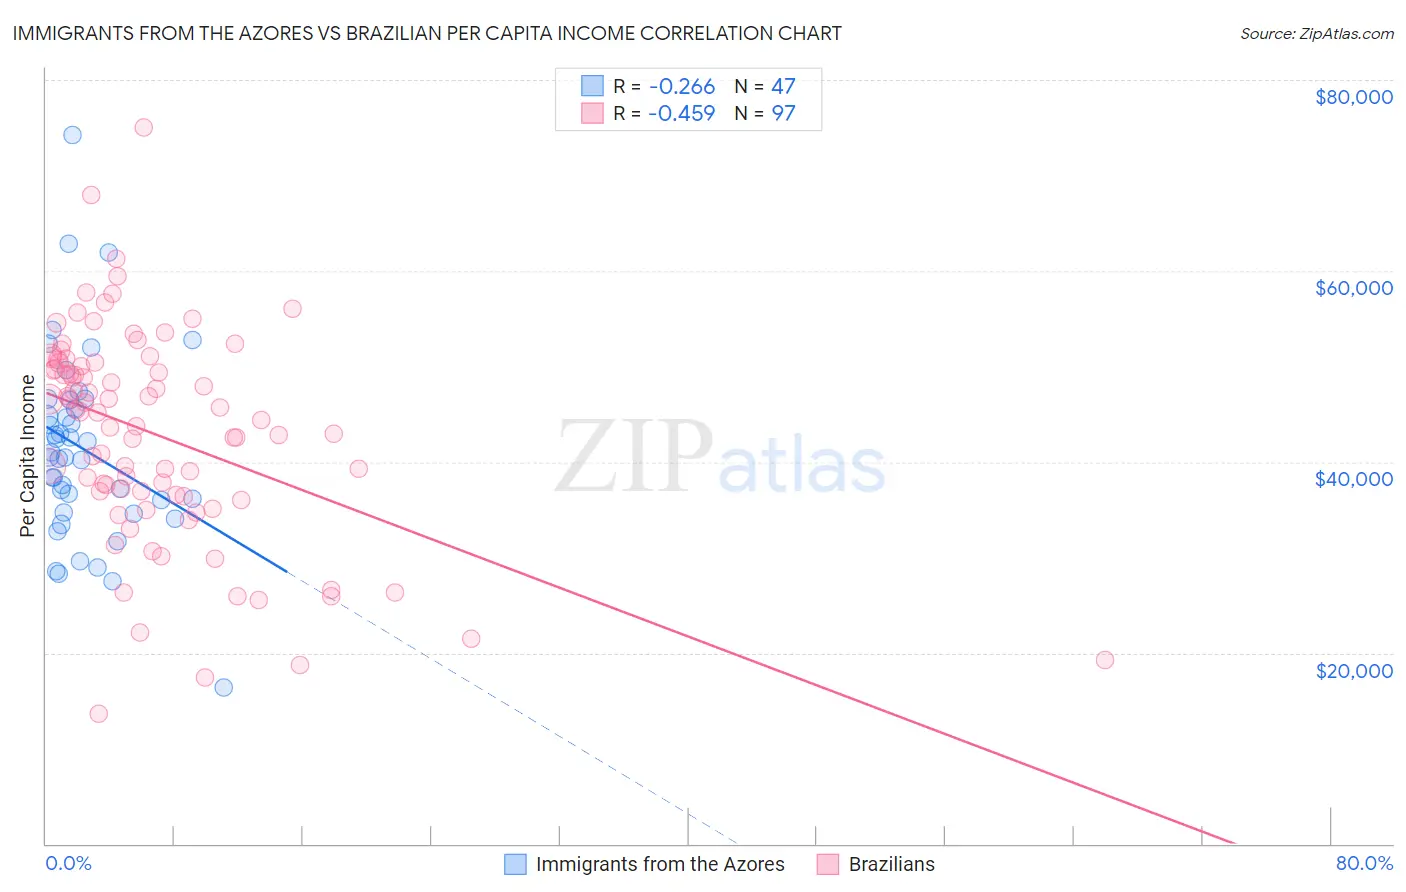
Immigrants from the Azores vs Brazilian Per Capita Income Correlation Chart
The statistical analysis conducted on geographies consisting of 46,254,060 people shows a weak negative correlation between the proportion of Immigrants from the Azores and per capita income in the United States with a correlation coefficient (R) of -0.266 and weighted average of $39,608. Similarly, the statistical analysis conducted on geographies consisting of 323,990,504 people shows a moderate negative correlation between the proportion of Brazilians and per capita income in the United States with a correlation coefficient (R) of -0.459 and weighted average of $46,700, a difference of 17.9%.
Per Capita Income Correlation Summary
| Measurement | Immigrants from the Azores | Brazilian |
| Minimum | $16,377 | $13,624 |
| Maximum | $74,187 | $75,068 |
| Range | $57,810 | $61,444 |
| Mean | $41,323 | $42,865 |
| Median | $40,470 | $45,205 |
| Interquartile 25% (IQ1) | $34,672 | $36,434 |
| Interquartile 75% (IQ3) | $46,446 | $50,401 |
| Interquartile Range (IQR) | $11,774 | $13,966 |
| Standard Deviation (Sample) | $10,106 | $11,177 |
| Standard Deviation (Population) | $9,998 | $11,120 |
Similar Demographics by Per Capita Income
Demographics Similar to Immigrants from the Azores by Per Capita Income
In terms of per capita income, the demographic groups most similar to Immigrants from the Azores are Osage ($39,568, a difference of 0.10%), Alaska Native ($39,558, a difference of 0.13%), Immigrants from Middle Africa ($39,529, a difference of 0.20%), Hawaiian ($39,403, a difference of 0.52%), and Immigrants from Burma/Myanmar ($39,827, a difference of 0.55%).
| Demographics | Rating | Rank | Per Capita Income |
| Sub-Saharan Africans | 1.9 /100 | #245 | Tragic $40,152 |
| Cree | 1.7 /100 | #246 | Tragic $40,056 |
| Immigrants | Somalia | 1.6 /100 | #247 | Tragic $39,974 |
| Cape Verdeans | 1.5 /100 | #248 | Tragic $39,935 |
| Japanese | 1.4 /100 | #249 | Tragic $39,870 |
| Immigrants | Burma/Myanmar | 1.3 /100 | #250 | Tragic $39,827 |
| Samoans | 1.3 /100 | #251 | Tragic $39,826 |
| Immigrants | Azores | 1.0 /100 | #252 | Tragic $39,608 |
| Osage | 1.0 /100 | #253 | Tragic $39,568 |
| Alaska Natives | 1.0 /100 | #254 | Tragic $39,558 |
| Immigrants | Middle Africa | 1.0 /100 | #255 | Tragic $39,529 |
| Hawaiians | 0.8 /100 | #256 | Tragic $39,403 |
| Nicaraguans | 0.8 /100 | #257 | Tragic $39,372 |
| Jamaicans | 0.7 /100 | #258 | Tragic $39,231 |
| Malaysians | 0.7 /100 | #259 | Tragic $39,194 |
Demographics Similar to Brazilians by Per Capita Income
In terms of per capita income, the demographic groups most similar to Brazilians are British ($46,571, a difference of 0.28%), Ethiopian ($46,569, a difference of 0.28%), Syrian ($46,837, a difference of 0.29%), Serbian ($46,551, a difference of 0.32%), and Immigrants from Kuwait ($46,543, a difference of 0.34%).
| Demographics | Rating | Rank | Per Capita Income |
| Carpatho Rusyns | 98.2 /100 | #97 | Exceptional $47,248 |
| Immigrants | Pakistan | 97.9 /100 | #98 | Exceptional $47,084 |
| Laotians | 97.8 /100 | #99 | Exceptional $47,041 |
| Immigrants | Lebanon | 97.5 /100 | #100 | Exceptional $46,938 |
| Immigrants | Uzbekistan | 97.5 /100 | #101 | Exceptional $46,929 |
| Immigrants | Western Asia | 97.4 /100 | #102 | Exceptional $46,876 |
| Syrians | 97.2 /100 | #103 | Exceptional $46,837 |
| Brazilians | 96.8 /100 | #104 | Exceptional $46,700 |
| British | 96.3 /100 | #105 | Exceptional $46,571 |
| Ethiopians | 96.3 /100 | #106 | Exceptional $46,569 |
| Serbians | 96.2 /100 | #107 | Exceptional $46,551 |
| Immigrants | Kuwait | 96.2 /100 | #108 | Exceptional $46,543 |
| Immigrants | Northern Africa | 96.2 /100 | #109 | Exceptional $46,531 |
| Chileans | 95.9 /100 | #110 | Exceptional $46,459 |
| Taiwanese | 95.8 /100 | #111 | Exceptional $46,455 |