Palestinian vs Immigrants from Jordan Median Family Income

COMPARE

Palestinian
Race
Ancestry
AfghanAfricanAlaska NativeAlaskan AthabascanAlbanianAleutAlsatianAmericanApacheArabArapahoArgentineanArmenianAssyrian/Chaldean/SyriacAustralianAustrianBahamianBangladeshiBarbadianBasqueBelgianBelizeanBermudanBhutaneseBlackfeetBolivianBrazilianBritishBritish West IndianBulgarianBurmeseCajunCambodianCanadianCape VerdeanCarpatho RusynCelticCentral AmericanCentral American IndianCherokeeCheyenneChickasawChileanChineseChippewaChoctawColombianColvilleComancheCosta RicanCreeCreekCroatianCrowCubanCypriotCzechCzechoslovakianDanishDelawareDominicanDutchDutch West IndianEastern EuropeanEcuadorianEgyptianEnglishEstonianEthiopianEuropeanFijianFilipinoFinnishFrenchFrench American IndianFrench CanadianGermanGerman RussianGhanaianGreekGuamanian/ChamorroGuatemalanGuyaneseHaitianHmongHonduranHopiHoumaHungarianIcelanderIndian (Asian)IndonesianInupiatIranianIraqiIrishIroquoisIsraeliItalianJamaicanJapaneseJordanianKenyanKiowaKoreanLaotianLatvianLebaneseLiberianLithuanianLumbeeLuxembourgerMacedonianMalaysianMalteseMarshalleseMenomineeMexicanMexican American IndianMongolianMoroccanNative HawaiianNavajoNepaleseNew ZealanderNicaraguanNigerianNorthern EuropeanNorwegianOkinawanOsageOttawaPaiutePakistaniPalestinianPanamanianParaguayanPennsylvania GermanPeruvianPimaPolishPortuguesePotawatomiPuebloPuerto RicanPuget Sound SalishRomanianRussianSalvadoranSamoanScandinavianScotch-IrishScottishSeminoleSenegaleseSerbianShoshoneSierra LeoneanSiouxSlavicSlovakSloveneSomaliSouth AfricanSouth AmericanSouth American IndianSoviet UnionSpaniardSpanishSpanish AmericanSpanish American IndianSri LankanSubsaharan AfricanSudaneseSwedishSwissSyrianTaiwaneseThaiTlingit-HaidaTohono O'OdhamTonganTrinidadian and TobagonianTsimshianTurkishU.S. Virgin IslanderUgandanUkrainianUruguayanUteVenezuelanVietnameseWelshWest IndianYakamaYaquiYugoslavianYumanYup'ikZimbabwean
Immigration
NonimmigrantsImmigrantsAfghanistanAfricaAlbaniaArgentinaArmeniaAsiaAustraliaAustriaBahamasBangladeshBarbadosBelarusBelgiumBelizeBoliviaBosnia and HerzegovinaBrazilBulgariaBurma/MyanmarCabo VerdeCambodiaCameroonCanadaCaribbeanCentral AmericaChileChinaColombiaCongoCosta RicaCroatiaCubaCzechoslovakiaDenmarkDominicaDominican RepublicEastern AfricaEastern AsiaEastern EuropeEcuadorEgyptEl SalvadorEnglandEritreaEthiopiaEuropeFijiFranceGermanyGhanaGreeceGrenadaGuatemalaGuyanaHaitiHondurasHong KongHungaryIndiaIndonesiaIranIraqIrelandIsraelItalyJamaicaJapanKazakhstanKenyaKoreaKuwaitLaosLatin AmericaLatviaLebanonLiberiaLithuaniaMalaysiaMexicoMicronesiaMiddle AfricaMoldovaMoroccoNepalNetherlandsNicaraguaNigeriaNorth AmericaNorth MacedoniaNorthern AfricaNorthern EuropeNorwayOceaniaPakistanPanamaPeruPhilippinesPolandPortugalRomaniaRussiaSaudi ArabiaScotlandSenegalSerbiaSierra LeoneSingaporeSomaliaSouth AfricaSouth AmericaSouth Central AsiaSouth Eastern AsiaSouthern EuropeSpainSri LankaSt. Vincent and the GrenadinesSudanSwedenSwitzerlandSyriaTaiwanThailandTrinidad and TobagoTurkeyUgandaUkraineUruguayUzbekistanVenezuelaVietnamWest IndiesWestern AfricaWestern AsiaWestern EuropeYemenZaireZimbabweAzores
Immigrants from Jordan
Race
Ancestry
AfghanAfricanAlaska NativeAlaskan AthabascanAlbanianAleutAlsatianAmericanApacheArabArapahoArgentineanArmenianAssyrian/Chaldean/SyriacAustralianAustrianBahamianBangladeshiBarbadianBasqueBelgianBelizeanBermudanBhutaneseBlackfeetBolivianBrazilianBritishBritish West IndianBulgarianBurmeseCajunCambodianCanadianCape VerdeanCarpatho RusynCelticCentral AmericanCentral American IndianCherokeeCheyenneChickasawChileanChineseChippewaChoctawColombianColvilleComancheCosta RicanCreeCreekCroatianCrowCubanCypriotCzechCzechoslovakianDanishDelawareDominicanDutchDutch West IndianEastern EuropeanEcuadorianEgyptianEnglishEstonianEthiopianEuropeanFijianFilipinoFinnishFrenchFrench American IndianFrench CanadianGermanGerman RussianGhanaianGreekGuamanian/ChamorroGuatemalanGuyaneseHaitianHmongHonduranHopiHoumaHungarianIcelanderIndian (Asian)IndonesianInupiatIranianIraqiIrishIroquoisIsraeliItalianJamaicanJapaneseJordanianKenyanKiowaKoreanLaotianLatvianLebaneseLiberianLithuanianLumbeeLuxembourgerMacedonianMalaysianMalteseMarshalleseMenomineeMexicanMexican American IndianMongolianMoroccanNative HawaiianNavajoNepaleseNew ZealanderNicaraguanNigerianNorthern EuropeanNorwegianOkinawanOsageOttawaPaiutePakistaniPanamanianParaguayanPennsylvania GermanPeruvianPimaPolishPortuguesePotawatomiPuebloPuerto RicanPuget Sound SalishRomanianRussianSalvadoranSamoanScandinavianScotch-IrishScottishSeminoleSenegaleseSerbianShoshoneSierra LeoneanSiouxSlavicSlovakSloveneSomaliSouth AfricanSouth AmericanSouth American IndianSoviet UnionSpaniardSpanishSpanish AmericanSpanish American IndianSri LankanSubsaharan AfricanSudaneseSwedishSwissSyrianTaiwaneseThaiTlingit-HaidaTohono O'OdhamTonganTrinidadian and TobagonianTsimshianTurkishU.S. Virgin IslanderUgandanUkrainianUruguayanUteVenezuelanVietnameseWelshWest IndianYakamaYaquiYugoslavianYumanYup'ikZimbabwean
Immigration
NonimmigrantsImmigrantsAfghanistanAfricaAlbaniaArgentinaArmeniaAsiaAustraliaAustriaBahamasBangladeshBarbadosBelarusBelgiumBelizeBoliviaBosnia and HerzegovinaBrazilBulgariaBurma/MyanmarCabo VerdeCambodiaCameroonCanadaCaribbeanCentral AmericaChileChinaColombiaCongoCosta RicaCroatiaCubaCzechoslovakiaDenmarkDominicaDominican RepublicEastern AfricaEastern AsiaEastern EuropeEcuadorEgyptEl SalvadorEnglandEritreaEthiopiaEuropeFijiFranceGermanyGhanaGreeceGrenadaGuatemalaGuyanaHaitiHondurasHong KongHungaryIndiaIndonesiaIranIraqIrelandIsraelItalyJamaicaJapanJordanKazakhstanKenyaKoreaKuwaitLaosLatin AmericaLatviaLebanonLiberiaLithuaniaMalaysiaMexicoMicronesiaMiddle AfricaMoldovaMoroccoNepalNetherlandsNicaraguaNigeriaNorth AmericaNorth MacedoniaNorthern AfricaNorthern EuropeNorwayOceaniaPakistanPanamaPeruPhilippinesPolandPortugalRomaniaRussiaSaudi ArabiaScotlandSenegalSerbiaSierra LeoneSingaporeSomaliaSouth AfricaSouth AmericaSouth Central AsiaSouth Eastern AsiaSouthern EuropeSpainSri LankaSt. Vincent and the GrenadinesSudanSwedenSwitzerlandSyriaTaiwanThailandTrinidad and TobagoTurkeyUgandaUkraineUruguayUzbekistanVenezuelaVietnamWest IndiesWestern AfricaWestern AsiaWestern EuropeYemenZaireZimbabweAzores
Median Family Income
Income
Poverty
Unemployment
Labor Participation
Family Structure
Vehicle Availability
Education Level
Disability

Median Family Income Comparison

Palestinians

Immigrants from Jordan

Exceptional
Exceptional
$109,413
MEDIAN FAMILY INCOME
96.9/ 100
METRIC RATING
104th/ 347
METRIC RANK
$107,715
MEDIAN FAMILY INCOME
92.9/ 100
METRIC RATING
122nd/ 347
METRIC RANK

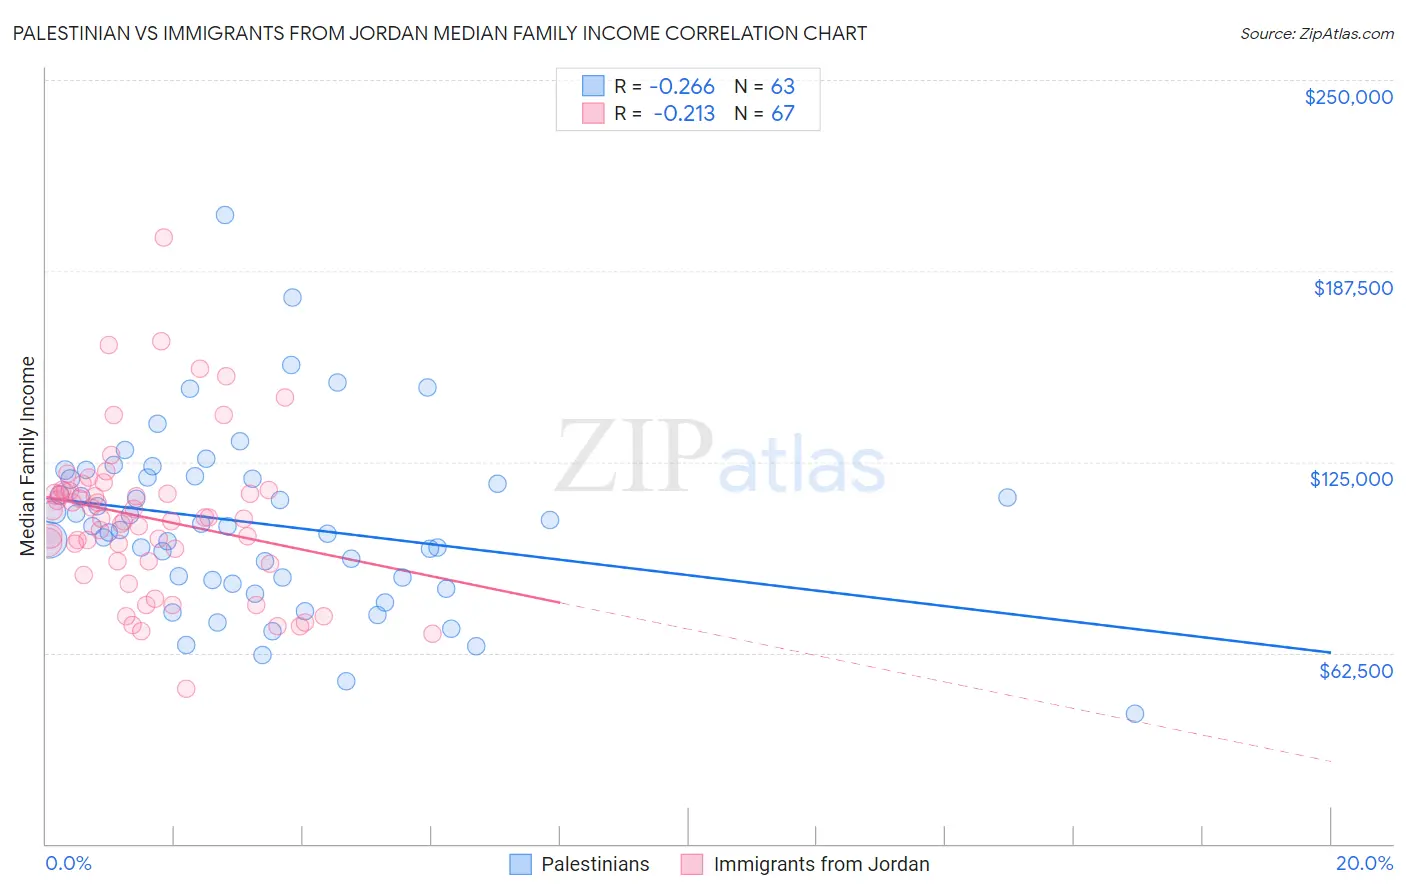
Palestinian vs Immigrants from Jordan Median Family Income Correlation Chart

The statistical analysis conducted on geographies consisting of 216,343,978 people shows a weak negative correlation between the proportion of Palestinians and median family income in the United States with a correlation coefficient (R) of -0.266 and weighted average of $109,413. Similarly, the statistical analysis conducted on geographies consisting of 181,223,835 people shows a weak negative correlation between the proportion of Immigrants from Jordan and median family income in the United States with a correlation coefficient (R) of -0.213 and weighted average of $107,715, a difference of 1.6%.
Palestinian vs Immigrants from Jordan Median Family Income

Median Family Income Correlation Summary

MeasurementPalestinianImmigrants from Jordan
Minimum$42,500$50,608
Maximum$205,817$198,467
Range$163,317$147,858
Mean$104,822$106,593
Median$104,046$106,540
Interquartile 25% (IQ1)$86,157$92,338
Interquartile 75% (IQ3)$120,000$115,517
Interquartile Range (IQR)$33,843$23,179
Standard Deviation (Sample)$28,885$25,689
Standard Deviation (Population)$28,655$25,497

Demographics Similar to Palestinians and Immigrants from Jordan by Median Family Income

In terms of median family income, the demographic groups most similar to Palestinians are Immigrants from Brazil ($109,418, a difference of 0.0%), Syrian ($109,299, a difference of 0.10%), Albanian ($109,136, a difference of 0.25%), Immigrants from North Macedonia ($109,136, a difference of 0.25%), and Immigrants from Zimbabwe ($108,830, a difference of 0.54%). Similarly, the demographic groups most similar to Immigrants from Jordan are Carpatho Rusyn ($107,502, a difference of 0.20%), European ($108,099, a difference of 0.36%), Immigrants from Northern Africa ($108,161, a difference of 0.41%), Sri Lankan ($108,234, a difference of 0.48%), and Ethiopian ($108,251, a difference of 0.50%).
DemographicsRating | RankMedian Family Income
Immigrants | Brazil
96.9
/100
|
#103
Exceptional
$109,418
Palestinians
96.9
/100
|
#104
Exceptional
$109,413
Syrians
96.7
/100
|
#105
Exceptional
$109,299
Albanians
96.4
/100
|
#106
Exceptional
$109,136
Immigrants | North Macedonia
96.4
/100
|
#107
Exceptional
$109,136
Immigrants | Zimbabwe
95.9
/100
|
#108
Exceptional
$108,830
Immigrants | Afghanistan
95.6
/100
|
#109
Exceptional
$108,709
British
95.6
/100
|
#110
Exceptional
$108,705
Immigrants | Western Asia
95.6
/100
|
#111
Exceptional
$108,691
Immigrants | Poland
95.3
/100
|
#112
Exceptional
$108,570
Immigrants | Saudi Arabia
95.2
/100
|
#113
Exceptional
$108,544
Poles
95.2
/100
|
#114
Exceptional
$108,507
Swedes
95.1
/100
|
#115
Exceptional
$108,499
Chileans
95.0
/100
|
#116
Exceptional
$108,429
Immigrants | Philippines
94.6
/100
|
#117
Exceptional
$108,288
Ethiopians
94.5
/100
|
#118
Exceptional
$108,251
Sri Lankans
94.5
/100
|
#119
Exceptional
$108,234
Immigrants | Northern Africa
94.3
/100
|
#120
Exceptional
$108,161
Europeans
94.1
/100
|
#121
Exceptional
$108,099
Immigrants | Jordan
92.9
/100
|
#122
Exceptional
$107,715
Carpatho Rusyns
92.2
/100
|
#123
Exceptional
$107,502