Ethiopian vs Jamaican Associate's Degree
COMPARE
Ethiopian
Jamaican
Associate's Degree
Associate's Degree Comparison
Ethiopians
Jamaicans
50.4%
ASSOCIATE'S DEGREE
99.1/ 100
METRIC RATING
79th/ 347
METRIC RANK
42.1%
ASSOCIATE'S DEGREE
0.7/ 100
METRIC RATING
249th/ 347
METRIC RANK
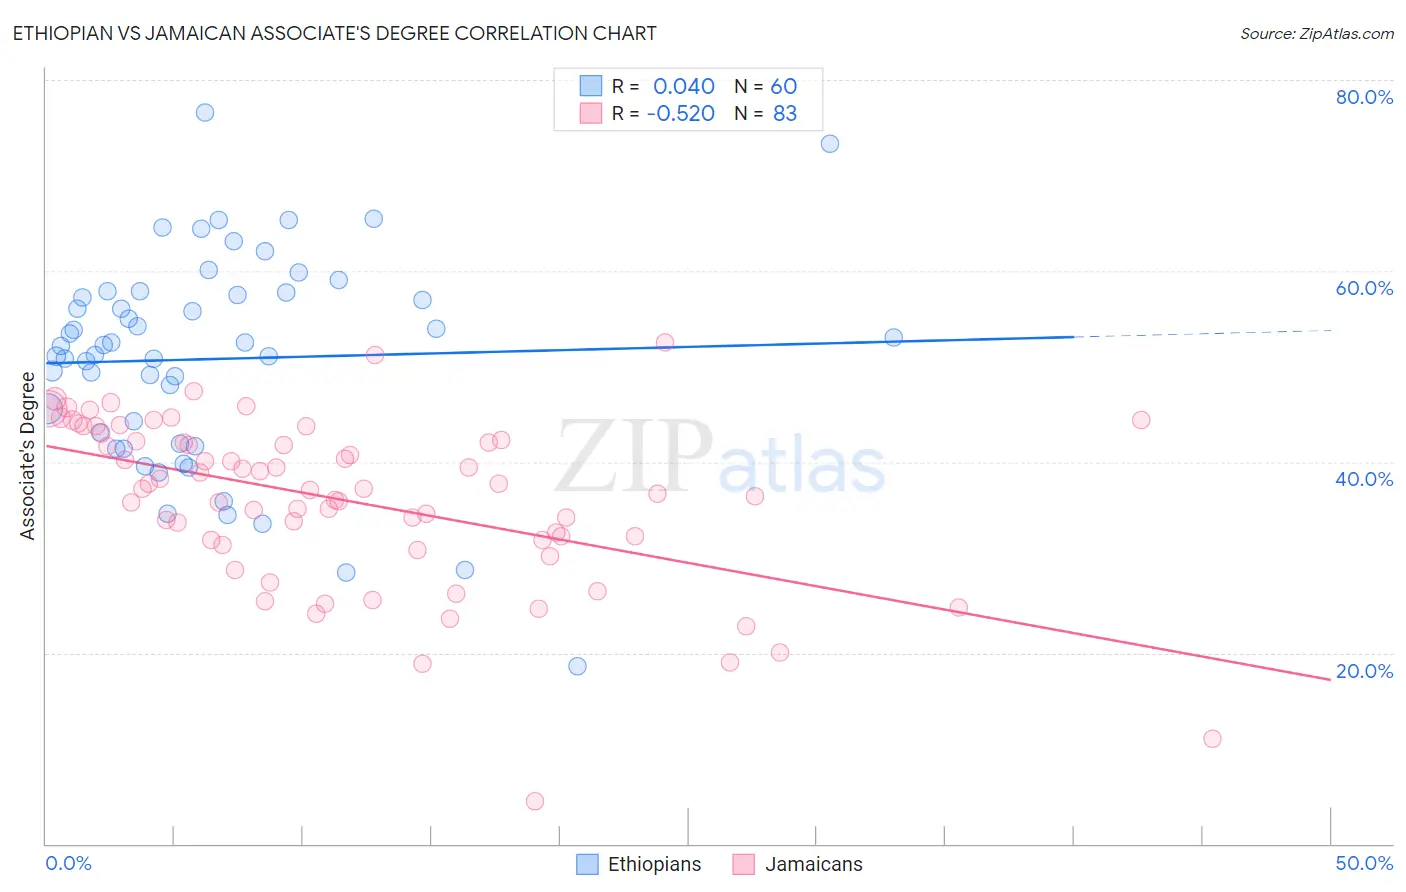
Ethiopian vs Jamaican Associate's Degree Correlation Chart
The statistical analysis conducted on geographies consisting of 223,259,495 people shows no correlation between the proportion of Ethiopians and percentage of population with at least associate's degree education in the United States with a correlation coefficient (R) of 0.040 and weighted average of 50.4%. Similarly, the statistical analysis conducted on geographies consisting of 368,030,405 people shows a substantial negative correlation between the proportion of Jamaicans and percentage of population with at least associate's degree education in the United States with a correlation coefficient (R) of -0.520 and weighted average of 42.1%, a difference of 19.8%.
Associate's Degree Correlation Summary
| Measurement | Ethiopian | Jamaican |
| Minimum | 18.6% | 4.5% |
| Maximum | 76.6% | 52.5% |
| Range | 58.0% | 48.0% |
| Mean | 50.8% | 36.0% |
| Median | 52.2% | 37.1% |
| Interquartile 25% (IQ1) | 42.5% | 31.8% |
| Interquartile 75% (IQ3) | 57.6% | 42.2% |
| Interquartile Range (IQR) | 15.1% | 10.4% |
| Standard Deviation (Sample) | 11.1% | 8.8% |
| Standard Deviation (Population) | 11.0% | 8.8% |
Similar Demographics by Associate's Degree
Demographics Similar to Ethiopians by Associate's Degree
In terms of associate's degree, the demographic groups most similar to Ethiopians are Immigrants from Eastern Europe (50.5%, a difference of 0.010%), Armenian (50.4%, a difference of 0.030%), Immigrants from Lebanon (50.5%, a difference of 0.060%), Immigrants from Zimbabwe (50.5%, a difference of 0.090%), and Maltese (50.4%, a difference of 0.10%).
| Demographics | Rating | Rank | Associate's Degree |
| Immigrants | Pakistan | 99.5 /100 | #72 | Exceptional 50.9% |
| Carpatho Rusyns | 99.3 /100 | #73 | Exceptional 50.6% |
| Lithuanians | 99.3 /100 | #74 | Exceptional 50.6% |
| Immigrants | Scotland | 99.3 /100 | #75 | Exceptional 50.6% |
| Immigrants | Zimbabwe | 99.2 /100 | #76 | Exceptional 50.5% |
| Immigrants | Lebanon | 99.1 /100 | #77 | Exceptional 50.5% |
| Immigrants | Eastern Europe | 99.1 /100 | #78 | Exceptional 50.5% |
| Ethiopians | 99.1 /100 | #79 | Exceptional 50.4% |
| Armenians | 99.1 /100 | #80 | Exceptional 50.4% |
| Maltese | 99.1 /100 | #81 | Exceptional 50.4% |
| Greeks | 98.9 /100 | #82 | Exceptional 50.3% |
| Immigrants | Uzbekistan | 98.9 /100 | #83 | Exceptional 50.3% |
| Immigrants | Hungary | 98.9 /100 | #84 | Exceptional 50.2% |
| Immigrants | Egypt | 98.9 /100 | #85 | Exceptional 50.2% |
| Immigrants | Croatia | 98.9 /100 | #86 | Exceptional 50.2% |
Demographics Similar to Jamaicans by Associate's Degree
In terms of associate's degree, the demographic groups most similar to Jamaicans are U.S. Virgin Islander (42.1%, a difference of 0.010%), Immigrants from Bahamas (42.1%, a difference of 0.030%), Immigrants from Ecuador (42.2%, a difference of 0.14%), Immigrants from Fiji (42.2%, a difference of 0.23%), and Delaware (42.3%, a difference of 0.32%).
| Demographics | Rating | Rank | Associate's Degree |
| Immigrants | West Indies | 1.0 /100 | #242 | Tragic 42.4% |
| Guyanese | 1.0 /100 | #243 | Tragic 42.3% |
| Immigrants | Liberia | 0.9 /100 | #244 | Tragic 42.3% |
| Immigrants | Cambodia | 0.9 /100 | #245 | Tragic 42.3% |
| Delaware | 0.9 /100 | #246 | Tragic 42.3% |
| Immigrants | Fiji | 0.8 /100 | #247 | Tragic 42.2% |
| Immigrants | Ecuador | 0.8 /100 | #248 | Tragic 42.2% |
| Jamaicans | 0.7 /100 | #249 | Tragic 42.1% |
| U.S. Virgin Islanders | 0.7 /100 | #250 | Tragic 42.1% |
| Immigrants | Bahamas | 0.7 /100 | #251 | Tragic 42.1% |
| French American Indians | 0.6 /100 | #252 | Tragic 42.0% |
| Indonesians | 0.6 /100 | #253 | Tragic 41.9% |
| Cubans | 0.6 /100 | #254 | Tragic 41.9% |
| Immigrants | Guyana | 0.5 /100 | #255 | Tragic 41.8% |
| Immigrants | Congo | 0.5 /100 | #256 | Tragic 41.8% |