Ethiopian vs Pima Median Female Earnings
COMPARE
Ethiopian
Pima
Median Female Earnings
Median Female Earnings Comparison
Ethiopians
Pima
$43,243
MEDIAN FEMALE EARNINGS
99.9/ 100
METRIC RATING
57th/ 347
METRIC RANK
$35,326
MEDIAN FEMALE EARNINGS
0.0/ 100
METRIC RATING
301st/ 347
METRIC RANK
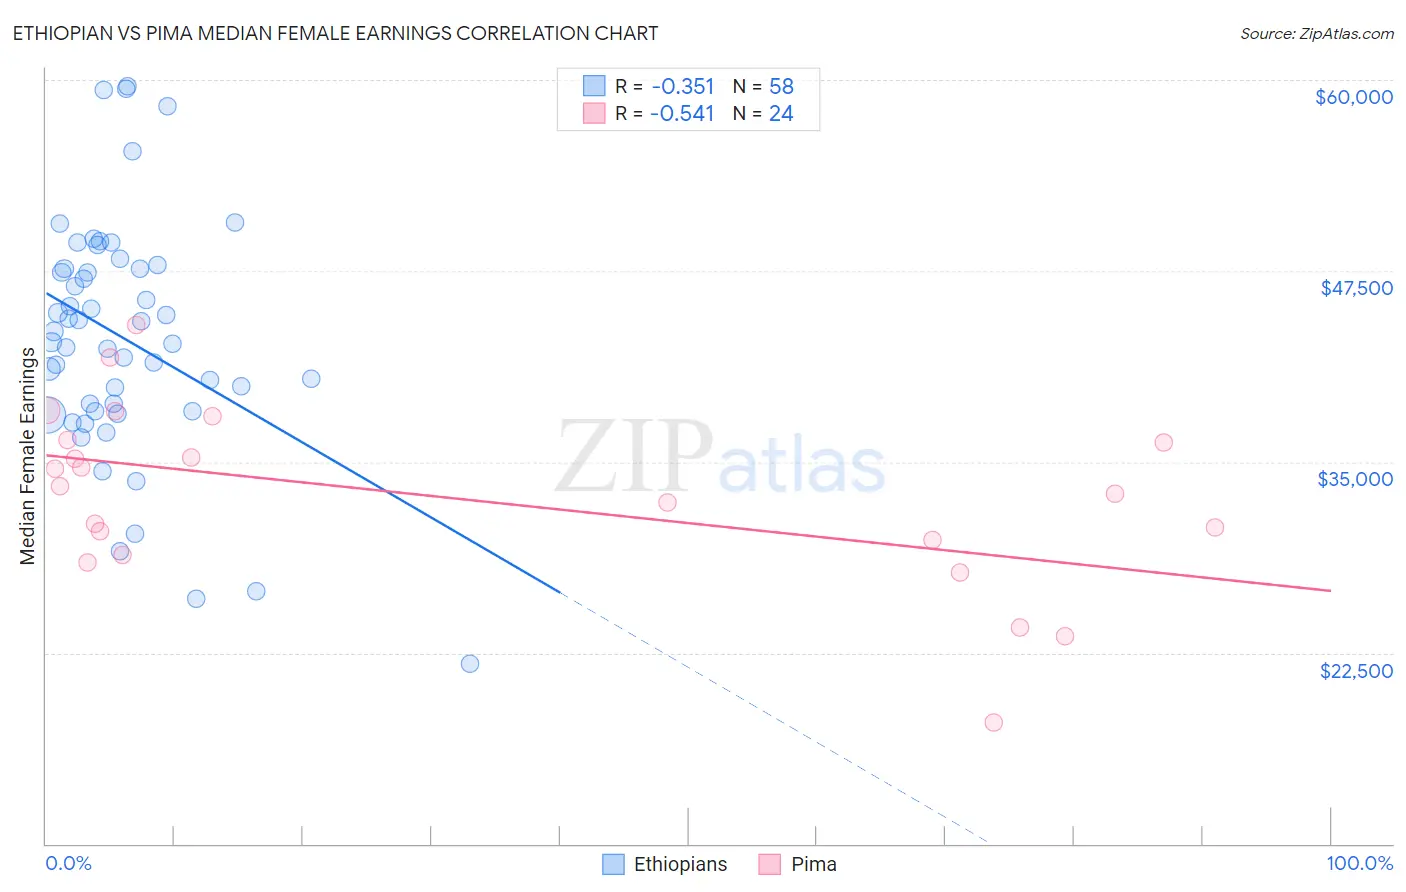
Ethiopian vs Pima Median Female Earnings Correlation Chart
The statistical analysis conducted on geographies consisting of 223,241,748 people shows a mild negative correlation between the proportion of Ethiopians and median female earnings in the United States with a correlation coefficient (R) of -0.351 and weighted average of $43,243. Similarly, the statistical analysis conducted on geographies consisting of 61,524,471 people shows a substantial negative correlation between the proportion of Pima and median female earnings in the United States with a correlation coefficient (R) of -0.541 and weighted average of $35,326, a difference of 22.4%.
Median Female Earnings Correlation Summary
| Measurement | Ethiopian | Pima |
| Minimum | $21,797 | $17,917 |
| Maximum | $59,585 | $43,952 |
| Range | $37,788 | $26,035 |
| Mean | $43,098 | $32,676 |
| Median | $43,184 | $33,171 |
| Interquartile 25% (IQ1) | $38,309 | $29,398 |
| Interquartile 75% (IQ3) | $47,681 | $36,333 |
| Interquartile Range (IQR) | $9,372 | $6,935 |
| Standard Deviation (Sample) | $7,882 | $5,900 |
| Standard Deviation (Population) | $7,814 | $5,776 |
Similar Demographics by Median Female Earnings
Demographics Similar to Ethiopians by Median Female Earnings
In terms of median female earnings, the demographic groups most similar to Ethiopians are Immigrants from Croatia ($43,258, a difference of 0.040%), Egyptian ($43,305, a difference of 0.14%), Immigrants from Eastern Europe ($43,309, a difference of 0.15%), Australian ($43,308, a difference of 0.15%), and Paraguayan ($43,173, a difference of 0.16%).
| Demographics | Rating | Rank | Median Female Earnings |
| Immigrants | Uzbekistan | 100.0 /100 | #50 | Exceptional $43,363 |
| Maltese | 100.0 /100 | #51 | Exceptional $43,357 |
| Immigrants | Lithuania | 99.9 /100 | #52 | Exceptional $43,317 |
| Immigrants | Eastern Europe | 99.9 /100 | #53 | Exceptional $43,309 |
| Australians | 99.9 /100 | #54 | Exceptional $43,308 |
| Egyptians | 99.9 /100 | #55 | Exceptional $43,305 |
| Immigrants | Croatia | 99.9 /100 | #56 | Exceptional $43,258 |
| Ethiopians | 99.9 /100 | #57 | Exceptional $43,243 |
| Paraguayans | 99.9 /100 | #58 | Exceptional $43,173 |
| Estonians | 99.9 /100 | #59 | Exceptional $43,106 |
| Immigrants | Latvia | 99.9 /100 | #60 | Exceptional $43,099 |
| Immigrants | Bulgaria | 99.9 /100 | #61 | Exceptional $43,085 |
| Afghans | 99.9 /100 | #62 | Exceptional $43,077 |
| Immigrants | Ukraine | 99.9 /100 | #63 | Exceptional $43,069 |
| Immigrants | Pakistan | 99.9 /100 | #64 | Exceptional $43,052 |
Demographics Similar to Pima by Median Female Earnings
In terms of median female earnings, the demographic groups most similar to Pima are Black/African American ($35,315, a difference of 0.030%), Immigrants from Latin America ($35,307, a difference of 0.050%), Yuman ($35,377, a difference of 0.14%), Crow ($35,266, a difference of 0.17%), and Immigrants from Guatemala ($35,444, a difference of 0.33%).
| Demographics | Rating | Rank | Median Female Earnings |
| Cheyenne | 0.0 /100 | #294 | Tragic $35,673 |
| Comanche | 0.0 /100 | #295 | Tragic $35,661 |
| Mexican American Indians | 0.0 /100 | #296 | Tragic $35,629 |
| Hmong | 0.0 /100 | #297 | Tragic $35,498 |
| Immigrants | Micronesia | 0.0 /100 | #298 | Tragic $35,477 |
| Immigrants | Guatemala | 0.0 /100 | #299 | Tragic $35,444 |
| Yuman | 0.0 /100 | #300 | Tragic $35,377 |
| Pima | 0.0 /100 | #301 | Tragic $35,326 |
| Blacks/African Americans | 0.0 /100 | #302 | Tragic $35,315 |
| Immigrants | Latin America | 0.0 /100 | #303 | Tragic $35,307 |
| Crow | 0.0 /100 | #304 | Tragic $35,266 |
| Bahamians | 0.0 /100 | #305 | Tragic $35,125 |
| Fijians | 0.0 /100 | #306 | Tragic $35,114 |
| Sioux | 0.0 /100 | #307 | Tragic $35,063 |
| Immigrants | Bahamas | 0.0 /100 | #308 | Tragic $35,027 |