Delaware vs Immigrants from Ireland Median Male Earnings
COMPARE
Delaware
Immigrants from Ireland
Median Male Earnings
Median Male Earnings Comparison
Delaware
Immigrants from Ireland
$52,412
MEDIAN MALE EARNINGS
11.5/ 100
METRIC RATING
210th/ 347
METRIC RANK
$67,698
MEDIAN MALE EARNINGS
100.0/ 100
METRIC RATING
11th/ 347
METRIC RANK
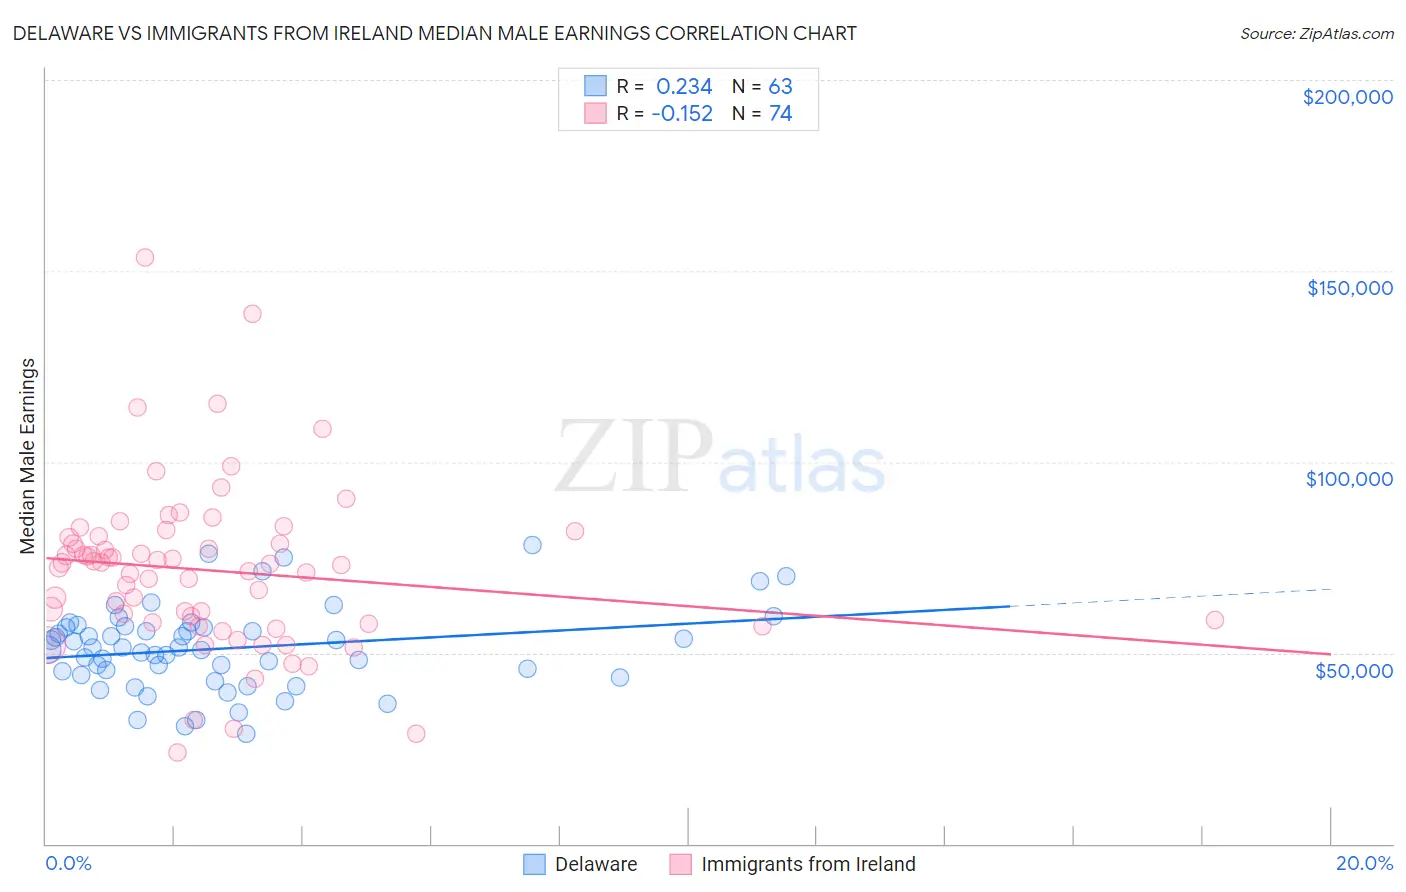
Delaware vs Immigrants from Ireland Median Male Earnings Correlation Chart
The statistical analysis conducted on geographies consisting of 96,215,096 people shows a weak positive correlation between the proportion of Delaware and median male earnings in the United States with a correlation coefficient (R) of 0.234 and weighted average of $52,412. Similarly, the statistical analysis conducted on geographies consisting of 240,726,887 people shows a poor negative correlation between the proportion of Immigrants from Ireland and median male earnings in the United States with a correlation coefficient (R) of -0.152 and weighted average of $67,698, a difference of 29.2%.
Median Male Earnings Correlation Summary
| Measurement | Delaware | Immigrants from Ireland |
| Minimum | $28,768 | $23,924 |
| Maximum | $78,250 | $153,576 |
| Range | $49,482 | $129,652 |
| Mean | $51,144 | $71,558 |
| Median | $51,243 | $73,213 |
| Interquartile 25% (IQ1) | $44,148 | $58,076 |
| Interquartile 75% (IQ3) | $56,755 | $80,238 |
| Interquartile Range (IQR) | $12,606 | $22,162 |
| Standard Deviation (Sample) | $10,850 | $21,669 |
| Standard Deviation (Population) | $10,763 | $21,523 |
Similar Demographics by Median Male Earnings
Demographics Similar to Delaware by Median Male Earnings
In terms of median male earnings, the demographic groups most similar to Delaware are Tlingit-Haida ($52,409, a difference of 0.010%), Bermudan ($52,465, a difference of 0.10%), Cajun ($52,325, a difference of 0.17%), Venezuelan ($52,510, a difference of 0.19%), and Native Hawaiian ($52,306, a difference of 0.20%).
| Demographics | Rating | Rank | Median Male Earnings |
| Panamanians | 16.5 /100 | #203 | Poor $52,835 |
| Ghanaians | 16.1 /100 | #204 | Poor $52,810 |
| Immigrants | Colombia | 15.0 /100 | #205 | Poor $52,725 |
| Immigrants | Iraq | 14.5 /100 | #206 | Poor $52,681 |
| Vietnamese | 12.7 /100 | #207 | Poor $52,525 |
| Venezuelans | 12.5 /100 | #208 | Poor $52,510 |
| Bermudans | 12.1 /100 | #209 | Poor $52,465 |
| Delaware | 11.5 /100 | #210 | Poor $52,412 |
| Tlingit-Haida | 11.5 /100 | #211 | Poor $52,409 |
| Cajuns | 10.7 /100 | #212 | Poor $52,325 |
| Native Hawaiians | 10.5 /100 | #213 | Poor $52,306 |
| Immigrants | Nonimmigrants | 9.3 /100 | #214 | Tragic $52,170 |
| Immigrants | Cameroon | 8.9 /100 | #215 | Tragic $52,119 |
| Immigrants | Venezuela | 8.3 /100 | #216 | Tragic $52,041 |
| Nigerians | 8.3 /100 | #217 | Tragic $52,039 |
Demographics Similar to Immigrants from Ireland by Median Male Earnings
In terms of median male earnings, the demographic groups most similar to Immigrants from Ireland are Immigrants from Australia ($67,634, a difference of 0.090%), Immigrants from China ($67,353, a difference of 0.51%), Okinawan ($67,232, a difference of 0.69%), Immigrants from Eastern Asia ($66,903, a difference of 1.2%), and Immigrants from Israel ($68,716, a difference of 1.5%).
| Demographics | Rating | Rank | Median Male Earnings |
| Thais | 100.0 /100 | #4 | Exceptional $72,135 |
| Immigrants | Singapore | 100.0 /100 | #5 | Exceptional $71,348 |
| Iranians | 100.0 /100 | #6 | Exceptional $70,648 |
| Immigrants | Hong Kong | 100.0 /100 | #7 | Exceptional $70,146 |
| Immigrants | Iran | 100.0 /100 | #8 | Exceptional $69,284 |
| Immigrants | South Central Asia | 100.0 /100 | #9 | Exceptional $68,960 |
| Immigrants | Israel | 100.0 /100 | #10 | Exceptional $68,716 |
| Immigrants | Ireland | 100.0 /100 | #11 | Exceptional $67,698 |
| Immigrants | Australia | 100.0 /100 | #12 | Exceptional $67,634 |
| Immigrants | China | 100.0 /100 | #13 | Exceptional $67,353 |
| Okinawans | 100.0 /100 | #14 | Exceptional $67,232 |
| Immigrants | Eastern Asia | 100.0 /100 | #15 | Exceptional $66,903 |
| Eastern Europeans | 100.0 /100 | #16 | Exceptional $66,472 |
| Immigrants | Belgium | 100.0 /100 | #17 | Exceptional $66,125 |
| Indians (Asian) | 100.0 /100 | #18 | Exceptional $66,078 |