Scottish vs Immigrants from Ireland Median Male Earnings
COMPARE
Scottish
Immigrants from Ireland
Median Male Earnings
Median Male Earnings Comparison
Scottish
Immigrants from Ireland
$55,793
MEDIAN MALE EARNINGS
78.2/ 100
METRIC RATING
148th/ 347
METRIC RANK
$67,698
MEDIAN MALE EARNINGS
100.0/ 100
METRIC RATING
11th/ 347
METRIC RANK
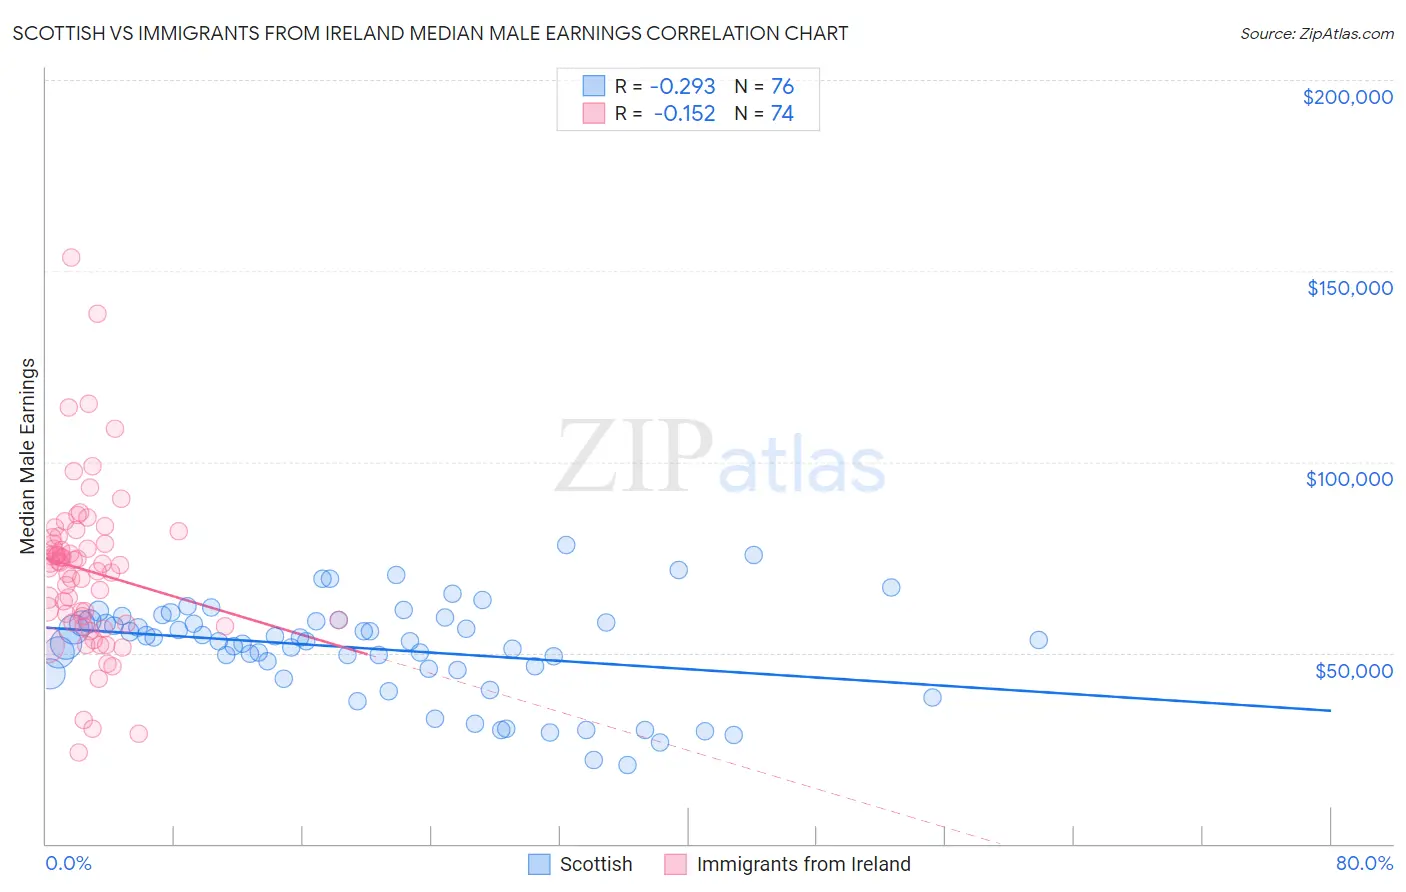
Scottish vs Immigrants from Ireland Median Male Earnings Correlation Chart
The statistical analysis conducted on geographies consisting of 565,821,197 people shows a weak negative correlation between the proportion of Scottish and median male earnings in the United States with a correlation coefficient (R) of -0.293 and weighted average of $55,793. Similarly, the statistical analysis conducted on geographies consisting of 240,726,887 people shows a poor negative correlation between the proportion of Immigrants from Ireland and median male earnings in the United States with a correlation coefficient (R) of -0.152 and weighted average of $67,698, a difference of 21.3%.
Median Male Earnings Correlation Summary
| Measurement | Scottish | Immigrants from Ireland |
| Minimum | $20,625 | $23,924 |
| Maximum | $78,335 | $153,576 |
| Range | $57,710 | $129,652 |
| Mean | $51,052 | $71,558 |
| Median | $53,253 | $73,213 |
| Interquartile 25% (IQ1) | $45,587 | $58,076 |
| Interquartile 75% (IQ3) | $58,253 | $80,238 |
| Interquartile Range (IQR) | $12,667 | $22,162 |
| Standard Deviation (Sample) | $12,626 | $21,669 |
| Standard Deviation (Population) | $12,543 | $21,523 |
Similar Demographics by Median Male Earnings
Demographics Similar to Scottish by Median Male Earnings
In terms of median male earnings, the demographic groups most similar to Scottish are Immigrants from Philippines ($55,809, a difference of 0.030%), English ($55,747, a difference of 0.080%), Swiss ($55,731, a difference of 0.11%), Immigrants from Oceania ($55,712, a difference of 0.15%), and Peruvian ($55,659, a difference of 0.24%).
| Demographics | Rating | Rank | Median Male Earnings |
| Danes | 84.8 /100 | #141 | Excellent $56,246 |
| Ethiopians | 84.8 /100 | #142 | Excellent $56,243 |
| Sri Lankans | 83.4 /100 | #143 | Excellent $56,136 |
| Immigrants | Uganda | 82.4 /100 | #144 | Excellent $56,064 |
| Norwegians | 80.9 /100 | #145 | Excellent $55,965 |
| Immigrants | Chile | 80.7 /100 | #146 | Excellent $55,954 |
| Immigrants | Philippines | 78.4 /100 | #147 | Good $55,809 |
| Scottish | 78.2 /100 | #148 | Good $55,793 |
| English | 77.4 /100 | #149 | Good $55,747 |
| Swiss | 77.1 /100 | #150 | Good $55,731 |
| Immigrants | Oceania | 76.8 /100 | #151 | Good $55,712 |
| Peruvians | 75.8 /100 | #152 | Good $55,659 |
| Immigrants | Nepal | 75.0 /100 | #153 | Good $55,615 |
| Taiwanese | 73.9 /100 | #154 | Good $55,556 |
| Scandinavians | 73.4 /100 | #155 | Good $55,527 |
Demographics Similar to Immigrants from Ireland by Median Male Earnings
In terms of median male earnings, the demographic groups most similar to Immigrants from Ireland are Immigrants from Australia ($67,634, a difference of 0.090%), Immigrants from China ($67,353, a difference of 0.51%), Okinawan ($67,232, a difference of 0.69%), Immigrants from Eastern Asia ($66,903, a difference of 1.2%), and Immigrants from Israel ($68,716, a difference of 1.5%).
| Demographics | Rating | Rank | Median Male Earnings |
| Thais | 100.0 /100 | #4 | Exceptional $72,135 |
| Immigrants | Singapore | 100.0 /100 | #5 | Exceptional $71,348 |
| Iranians | 100.0 /100 | #6 | Exceptional $70,648 |
| Immigrants | Hong Kong | 100.0 /100 | #7 | Exceptional $70,146 |
| Immigrants | Iran | 100.0 /100 | #8 | Exceptional $69,284 |
| Immigrants | South Central Asia | 100.0 /100 | #9 | Exceptional $68,960 |
| Immigrants | Israel | 100.0 /100 | #10 | Exceptional $68,716 |
| Immigrants | Ireland | 100.0 /100 | #11 | Exceptional $67,698 |
| Immigrants | Australia | 100.0 /100 | #12 | Exceptional $67,634 |
| Immigrants | China | 100.0 /100 | #13 | Exceptional $67,353 |
| Okinawans | 100.0 /100 | #14 | Exceptional $67,232 |
| Immigrants | Eastern Asia | 100.0 /100 | #15 | Exceptional $66,903 |
| Eastern Europeans | 100.0 /100 | #16 | Exceptional $66,472 |
| Immigrants | Belgium | 100.0 /100 | #17 | Exceptional $66,125 |
| Indians (Asian) | 100.0 /100 | #18 | Exceptional $66,078 |