Immigrants from Scotland vs Immigrants from Yemen Median Male Earnings
COMPARE
Immigrants from Scotland
Immigrants from Yemen
Median Male Earnings
Median Male Earnings Comparison
Immigrants from Scotland
Immigrants from Yemen
$61,220
MEDIAN MALE EARNINGS
99.9/ 100
METRIC RATING
57th/ 347
METRIC RANK
$44,083
MEDIAN MALE EARNINGS
0.0/ 100
METRIC RATING
334th/ 347
METRIC RANK
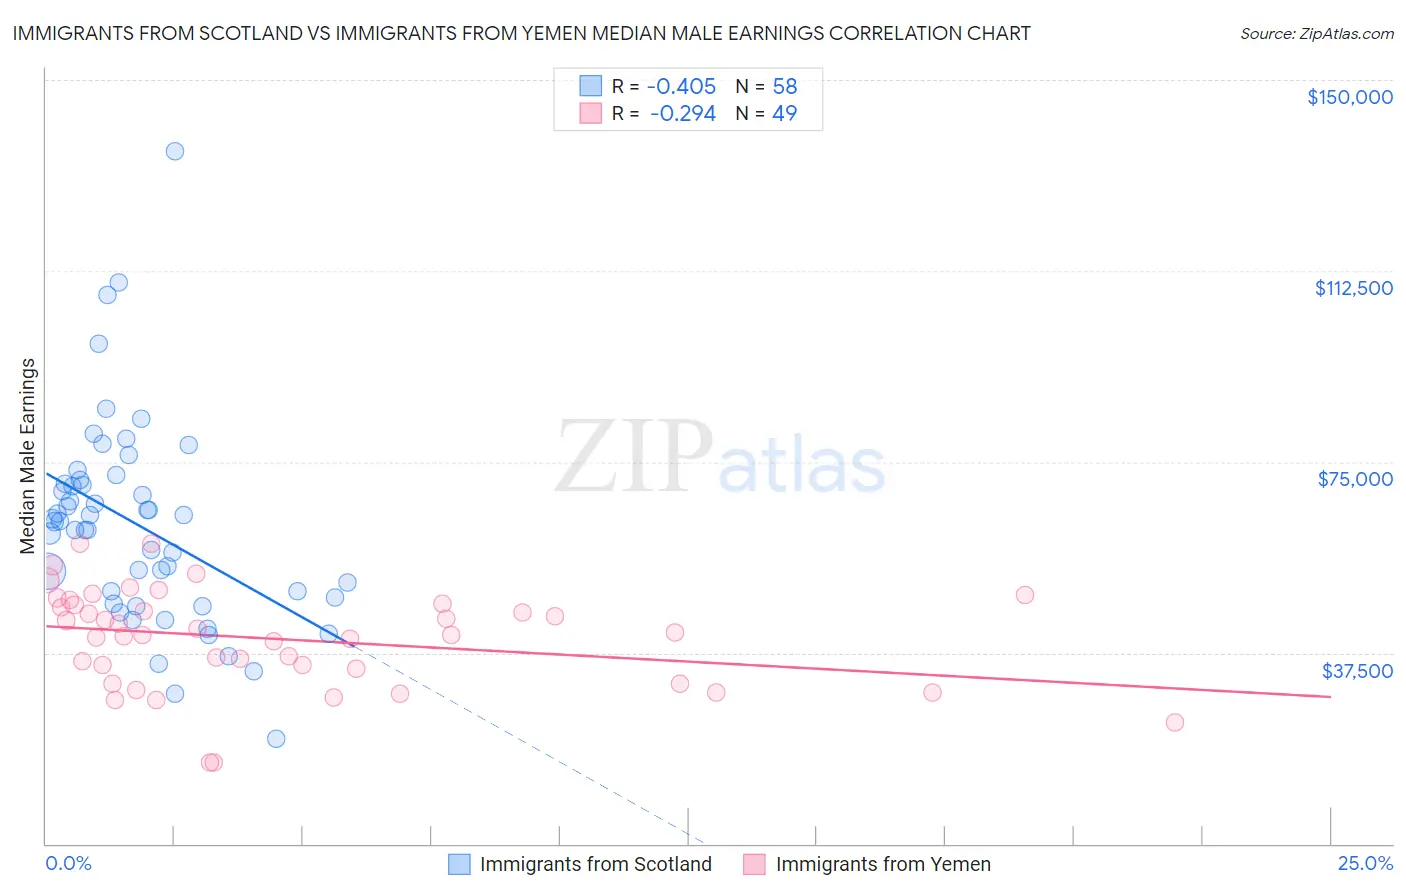
Immigrants from Scotland vs Immigrants from Yemen Median Male Earnings Correlation Chart
The statistical analysis conducted on geographies consisting of 196,362,899 people shows a moderate negative correlation between the proportion of Immigrants from Scotland and median male earnings in the United States with a correlation coefficient (R) of -0.405 and weighted average of $61,220. Similarly, the statistical analysis conducted on geographies consisting of 82,424,994 people shows a weak negative correlation between the proportion of Immigrants from Yemen and median male earnings in the United States with a correlation coefficient (R) of -0.294 and weighted average of $44,083, a difference of 38.9%.
Median Male Earnings Correlation Summary
| Measurement | Immigrants from Scotland | Immigrants from Yemen |
| Minimum | $20,588 | $15,864 |
| Maximum | $136,042 | $59,038 |
| Range | $115,454 | $43,174 |
| Mean | $62,522 | $40,188 |
| Median | $63,347 | $41,048 |
| Interquartile 25% (IQ1) | $48,304 | $32,940 |
| Interquartile 75% (IQ3) | $70,634 | $47,016 |
| Interquartile Range (IQR) | $22,330 | $14,075 |
| Standard Deviation (Sample) | $20,135 | $9,775 |
| Standard Deviation (Population) | $19,960 | $9,674 |
Similar Demographics by Median Male Earnings
Demographics Similar to Immigrants from Scotland by Median Male Earnings
In terms of median male earnings, the demographic groups most similar to Immigrants from Scotland are Lithuanian ($61,228, a difference of 0.010%), New Zealander ($61,199, a difference of 0.030%), Greek ($61,242, a difference of 0.040%), Immigrants from Netherlands ($61,096, a difference of 0.20%), and Egyptian ($61,095, a difference of 0.20%).
| Demographics | Rating | Rank | Median Male Earnings |
| Bhutanese | 99.9 /100 | #50 | Exceptional $61,759 |
| Estonians | 99.9 /100 | #51 | Exceptional $61,710 |
| Immigrants | Norway | 99.9 /100 | #52 | Exceptional $61,628 |
| South Africans | 99.9 /100 | #53 | Exceptional $61,460 |
| Immigrants | Latvia | 99.9 /100 | #54 | Exceptional $61,422 |
| Greeks | 99.9 /100 | #55 | Exceptional $61,242 |
| Lithuanians | 99.9 /100 | #56 | Exceptional $61,228 |
| Immigrants | Scotland | 99.9 /100 | #57 | Exceptional $61,220 |
| New Zealanders | 99.9 /100 | #58 | Exceptional $61,199 |
| Immigrants | Netherlands | 99.8 /100 | #59 | Exceptional $61,096 |
| Egyptians | 99.8 /100 | #60 | Exceptional $61,095 |
| Bolivians | 99.8 /100 | #61 | Exceptional $61,066 |
| Immigrants | Romania | 99.8 /100 | #62 | Exceptional $61,040 |
| Immigrants | Pakistan | 99.8 /100 | #63 | Exceptional $60,987 |
| Immigrants | Eastern Europe | 99.8 /100 | #64 | Exceptional $60,958 |
Demographics Similar to Immigrants from Yemen by Median Male Earnings
In terms of median male earnings, the demographic groups most similar to Immigrants from Yemen are Spanish American Indian ($44,010, a difference of 0.17%), Immigrants from Congo ($44,204, a difference of 0.27%), Immigrants from Cuba ($43,461, a difference of 1.4%), Bahamian ($44,756, a difference of 1.5%), and Native/Alaskan ($44,775, a difference of 1.6%).
| Demographics | Rating | Rank | Median Male Earnings |
| Immigrants | Bahamas | 0.0 /100 | #327 | Tragic $45,176 |
| Kiowa | 0.0 /100 | #328 | Tragic $45,094 |
| Yakama | 0.0 /100 | #329 | Tragic $45,002 |
| Immigrants | Mexico | 0.0 /100 | #330 | Tragic $44,960 |
| Natives/Alaskans | 0.0 /100 | #331 | Tragic $44,775 |
| Bahamians | 0.0 /100 | #332 | Tragic $44,756 |
| Immigrants | Congo | 0.0 /100 | #333 | Tragic $44,204 |
| Immigrants | Yemen | 0.0 /100 | #334 | Tragic $44,083 |
| Spanish American Indians | 0.0 /100 | #335 | Tragic $44,010 |
| Immigrants | Cuba | 0.0 /100 | #336 | Tragic $43,461 |
| Menominee | 0.0 /100 | #337 | Tragic $42,581 |
| Crow | 0.0 /100 | #338 | Tragic $42,434 |
| Pima | 0.0 /100 | #339 | Tragic $42,357 |
| Navajo | 0.0 /100 | #340 | Tragic $42,098 |
| Hopi | 0.0 /100 | #341 | Tragic $42,060 |