Egyptian vs American Median Family Income
COMPARE
Egyptian
American
Median Family Income
Median Family Income Comparison
Egyptians
Americans
$114,119
MEDIAN FAMILY INCOME
99.7/ 100
METRIC RATING
65th/ 347
METRIC RANK
$92,096
MEDIAN FAMILY INCOME
0.4/ 100
METRIC RATING
257th/ 347
METRIC RANK
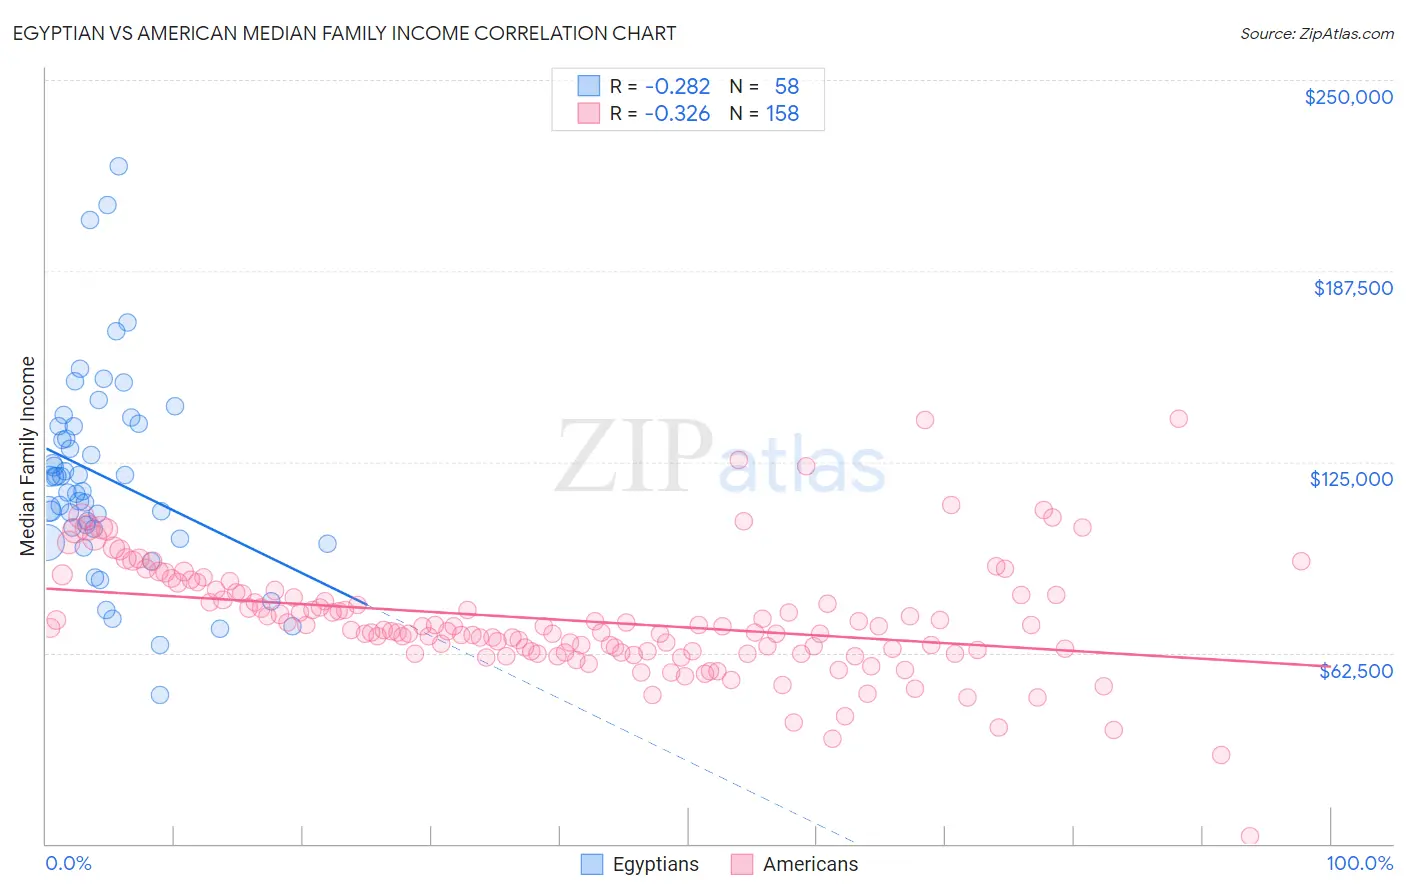
Egyptian vs American Median Family Income Correlation Chart
The statistical analysis conducted on geographies consisting of 276,687,434 people shows a weak negative correlation between the proportion of Egyptians and median family income in the United States with a correlation coefficient (R) of -0.282 and weighted average of $114,119. Similarly, the statistical analysis conducted on geographies consisting of 580,248,843 people shows a mild negative correlation between the proportion of Americans and median family income in the United States with a correlation coefficient (R) of -0.326 and weighted average of $92,096, a difference of 23.9%.
Median Family Income Correlation Summary
| Measurement | Egyptian | American |
| Minimum | $48,661 | $2,499 |
| Maximum | $221,912 | $139,235 |
| Range | $173,251 | $136,736 |
| Mean | $119,991 | $73,235 |
| Median | $117,654 | $70,309 |
| Interquartile 25% (IQ1) | $103,125 | $63,060 |
| Interquartile 75% (IQ3) | $136,794 | $81,871 |
| Interquartile Range (IQR) | $33,669 | $18,811 |
| Standard Deviation (Sample) | $33,329 | $18,957 |
| Standard Deviation (Population) | $33,040 | $18,897 |
Similar Demographics by Median Family Income
Demographics Similar to Egyptians by Median Family Income
In terms of median family income, the demographic groups most similar to Egyptians are Paraguayan ($114,016, a difference of 0.090%), Immigrants from Scotland ($114,392, a difference of 0.24%), Immigrants from Pakistan ($114,406, a difference of 0.25%), Immigrants from Spain ($113,815, a difference of 0.27%), and Mongolian ($114,553, a difference of 0.38%).
| Demographics | Rating | Rank | Median Family Income |
| Immigrants | Indonesia | 99.8 /100 | #58 | Exceptional $115,162 |
| Immigrants | Netherlands | 99.8 /100 | #59 | Exceptional $114,987 |
| Immigrants | Latvia | 99.8 /100 | #60 | Exceptional $114,826 |
| Immigrants | Belarus | 99.8 /100 | #61 | Exceptional $114,586 |
| Mongolians | 99.8 /100 | #62 | Exceptional $114,553 |
| Immigrants | Pakistan | 99.8 /100 | #63 | Exceptional $114,406 |
| Immigrants | Scotland | 99.7 /100 | #64 | Exceptional $114,392 |
| Egyptians | 99.7 /100 | #65 | Exceptional $114,119 |
| Paraguayans | 99.7 /100 | #66 | Exceptional $114,016 |
| Immigrants | Spain | 99.7 /100 | #67 | Exceptional $113,815 |
| Immigrants | Serbia | 99.6 /100 | #68 | Exceptional $113,463 |
| Immigrants | Bulgaria | 99.6 /100 | #69 | Exceptional $113,461 |
| Immigrants | Romania | 99.6 /100 | #70 | Exceptional $113,434 |
| South Africans | 99.5 /100 | #71 | Exceptional $113,229 |
| Afghans | 99.5 /100 | #72 | Exceptional $112,971 |
Demographics Similar to Americans by Median Family Income
In terms of median family income, the demographic groups most similar to Americans are Nicaraguan ($92,231, a difference of 0.15%), Immigrants from Laos ($92,239, a difference of 0.16%), Osage ($91,926, a difference of 0.19%), Cape Verdean ($91,848, a difference of 0.27%), and Immigrants from Barbados ($92,419, a difference of 0.35%).
| Demographics | Rating | Rank | Median Family Income |
| West Indians | 0.6 /100 | #250 | Tragic $92,765 |
| Immigrants | Somalia | 0.6 /100 | #251 | Tragic $92,609 |
| Immigrants | El Salvador | 0.6 /100 | #252 | Tragic $92,545 |
| Immigrants | Guyana | 0.6 /100 | #253 | Tragic $92,513 |
| Immigrants | Barbados | 0.5 /100 | #254 | Tragic $92,419 |
| Immigrants | Laos | 0.5 /100 | #255 | Tragic $92,239 |
| Nicaraguans | 0.5 /100 | #256 | Tragic $92,231 |
| Americans | 0.4 /100 | #257 | Tragic $92,096 |
| Osage | 0.4 /100 | #258 | Tragic $91,926 |
| Cape Verdeans | 0.4 /100 | #259 | Tragic $91,848 |
| Pennsylvania Germans | 0.4 /100 | #260 | Tragic $91,763 |
| Inupiat | 0.4 /100 | #261 | Tragic $91,730 |
| Liberians | 0.4 /100 | #262 | Tragic $91,722 |
| Immigrants | West Indies | 0.3 /100 | #263 | Tragic $91,588 |
| Senegalese | 0.3 /100 | #264 | Tragic $91,475 |