Immigrants from Afghanistan vs Immigrants from Yemen Median Household Income
COMPARE
Immigrants from Afghanistan
Immigrants from Yemen
Median Household Income
Median Household Income Comparison
Immigrants from Afghanistan
Immigrants from Yemen
$93,375
MEDIAN HOUSEHOLD INCOME
99.5/ 100
METRIC RATING
77th/ 347
METRIC RANK
$65,194
MEDIAN HOUSEHOLD INCOME
0.0/ 100
METRIC RATING
338th/ 347
METRIC RANK
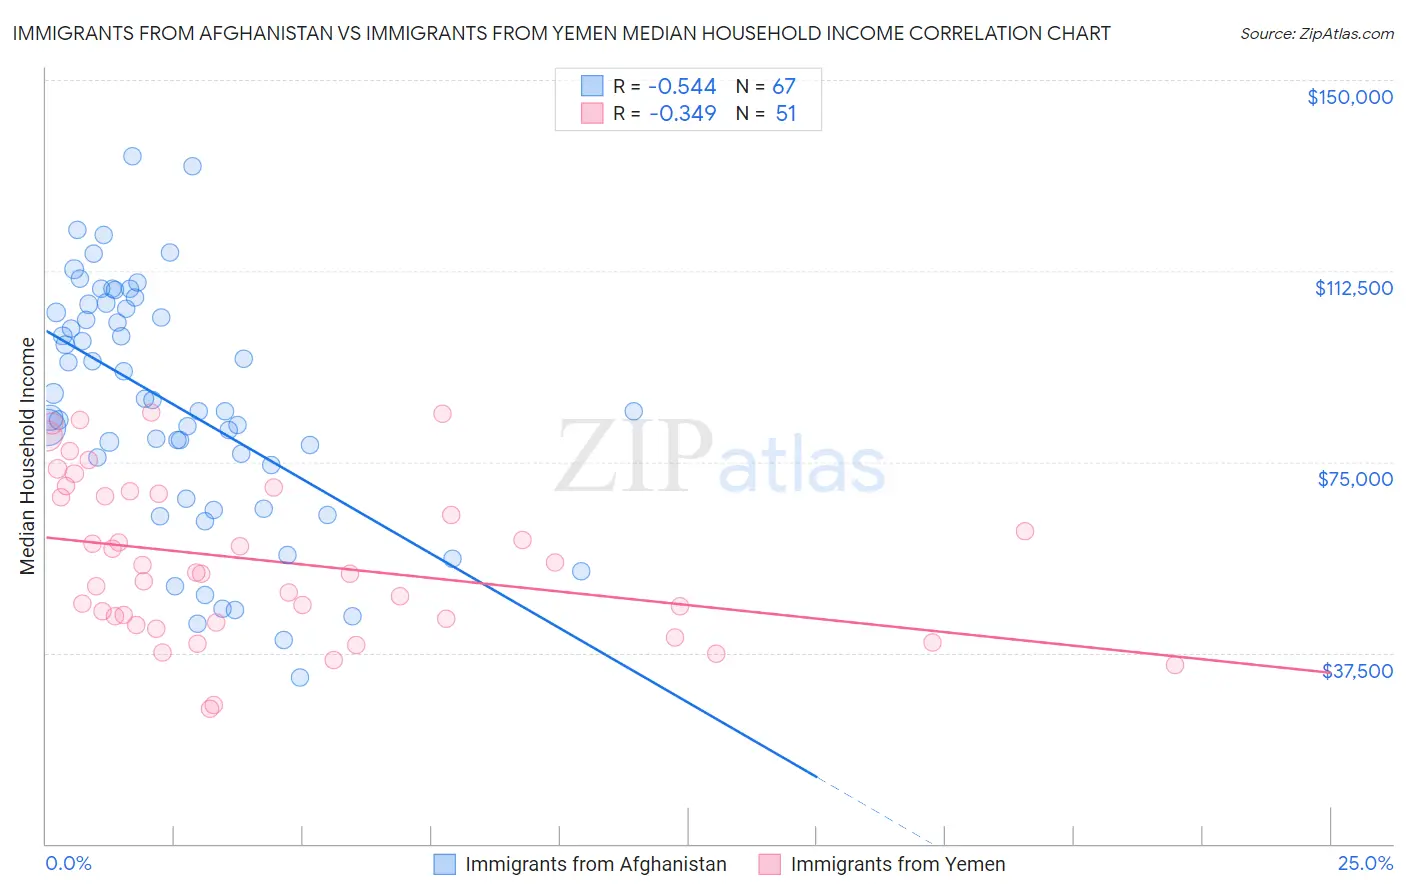
Immigrants from Afghanistan vs Immigrants from Yemen Median Household Income Correlation Chart
The statistical analysis conducted on geographies consisting of 147,635,708 people shows a substantial negative correlation between the proportion of Immigrants from Afghanistan and median household income in the United States with a correlation coefficient (R) of -0.544 and weighted average of $93,375. Similarly, the statistical analysis conducted on geographies consisting of 82,433,611 people shows a mild negative correlation between the proportion of Immigrants from Yemen and median household income in the United States with a correlation coefficient (R) of -0.349 and weighted average of $65,194, a difference of 43.2%.
Median Household Income Correlation Summary
| Measurement | Immigrants from Afghanistan | Immigrants from Yemen |
| Minimum | $32,569 | $26,635 |
| Maximum | $134,953 | $84,689 |
| Range | $102,384 | $58,054 |
| Mean | $86,066 | $55,369 |
| Median | $85,055 | $53,125 |
| Interquartile 25% (IQ1) | $67,813 | $43,348 |
| Interquartile 75% (IQ3) | $105,164 | $68,707 |
| Interquartile Range (IQR) | $37,351 | $25,359 |
| Standard Deviation (Sample) | $23,740 | $15,452 |
| Standard Deviation (Population) | $23,562 | $15,299 |
Similar Demographics by Median Household Income
Demographics Similar to Immigrants from Afghanistan by Median Household Income
In terms of median household income, the demographic groups most similar to Immigrants from Afghanistan are South African ($93,379, a difference of 0.0%), Immigrants from Italy ($93,465, a difference of 0.10%), Immigrants from Latvia ($93,602, a difference of 0.24%), Immigrants from Bulgaria ($93,148, a difference of 0.24%), and Sri Lankan ($93,093, a difference of 0.30%).
| Demographics | Rating | Rank | Median Household Income |
| Immigrants | Fiji | 99.7 /100 | #70 | Exceptional $93,933 |
| Immigrants | Philippines | 99.6 /100 | #71 | Exceptional $93,899 |
| Lithuanians | 99.6 /100 | #72 | Exceptional $93,852 |
| Immigrants | Egypt | 99.6 /100 | #73 | Exceptional $93,700 |
| Immigrants | Latvia | 99.6 /100 | #74 | Exceptional $93,602 |
| Immigrants | Italy | 99.5 /100 | #75 | Exceptional $93,465 |
| South Africans | 99.5 /100 | #76 | Exceptional $93,379 |
| Immigrants | Afghanistan | 99.5 /100 | #77 | Exceptional $93,375 |
| Immigrants | Bulgaria | 99.4 /100 | #78 | Exceptional $93,148 |
| Sri Lankans | 99.4 /100 | #79 | Exceptional $93,093 |
| Tongans | 99.4 /100 | #80 | Exceptional $93,076 |
| Immigrants | Eastern Europe | 99.4 /100 | #81 | Exceptional $93,051 |
| Immigrants | Spain | 99.3 /100 | #82 | Exceptional $92,732 |
| Italians | 99.1 /100 | #83 | Exceptional $92,475 |
| Immigrants | Argentina | 99.1 /100 | #84 | Exceptional $92,417 |
Demographics Similar to Immigrants from Yemen by Median Household Income
In terms of median household income, the demographic groups most similar to Immigrants from Yemen are Hopi ($65,043, a difference of 0.23%), Pueblo ($64,692, a difference of 0.78%), Kiowa ($65,914, a difference of 1.1%), Crow ($63,681, a difference of 2.4%), and Immigrants from Congo ($66,768, a difference of 2.4%).
| Demographics | Rating | Rank | Median Household Income |
| Natives/Alaskans | 0.0 /100 | #331 | Tragic $67,879 |
| Sioux | 0.0 /100 | #332 | Tragic $67,792 |
| Creek | 0.0 /100 | #333 | Tragic $67,715 |
| Blacks/African Americans | 0.0 /100 | #334 | Tragic $67,573 |
| Cheyenne | 0.0 /100 | #335 | Tragic $66,974 |
| Immigrants | Congo | 0.0 /100 | #336 | Tragic $66,768 |
| Kiowa | 0.0 /100 | #337 | Tragic $65,914 |
| Immigrants | Yemen | 0.0 /100 | #338 | Tragic $65,194 |
| Hopi | 0.0 /100 | #339 | Tragic $65,043 |
| Pueblo | 0.0 /100 | #340 | Tragic $64,692 |
| Crow | 0.0 /100 | #341 | Tragic $63,681 |
| Pima | 0.0 /100 | #342 | Tragic $63,262 |
| Houma | 0.0 /100 | #343 | Tragic $62,575 |
| Tohono O'odham | 0.0 /100 | #344 | Tragic $61,663 |
| Puerto Ricans | 0.0 /100 | #345 | Tragic $59,197 |