Costa Rican vs Immigrants from Yemen Median Household Income
COMPARE
Costa Rican
Immigrants from Yemen
Median Household Income
Median Household Income Comparison
Costa Ricans
Immigrants from Yemen
$87,262
MEDIAN HOUSEHOLD INCOME
80.0/ 100
METRIC RATING
148th/ 347
METRIC RANK
$65,194
MEDIAN HOUSEHOLD INCOME
0.0/ 100
METRIC RATING
338th/ 347
METRIC RANK
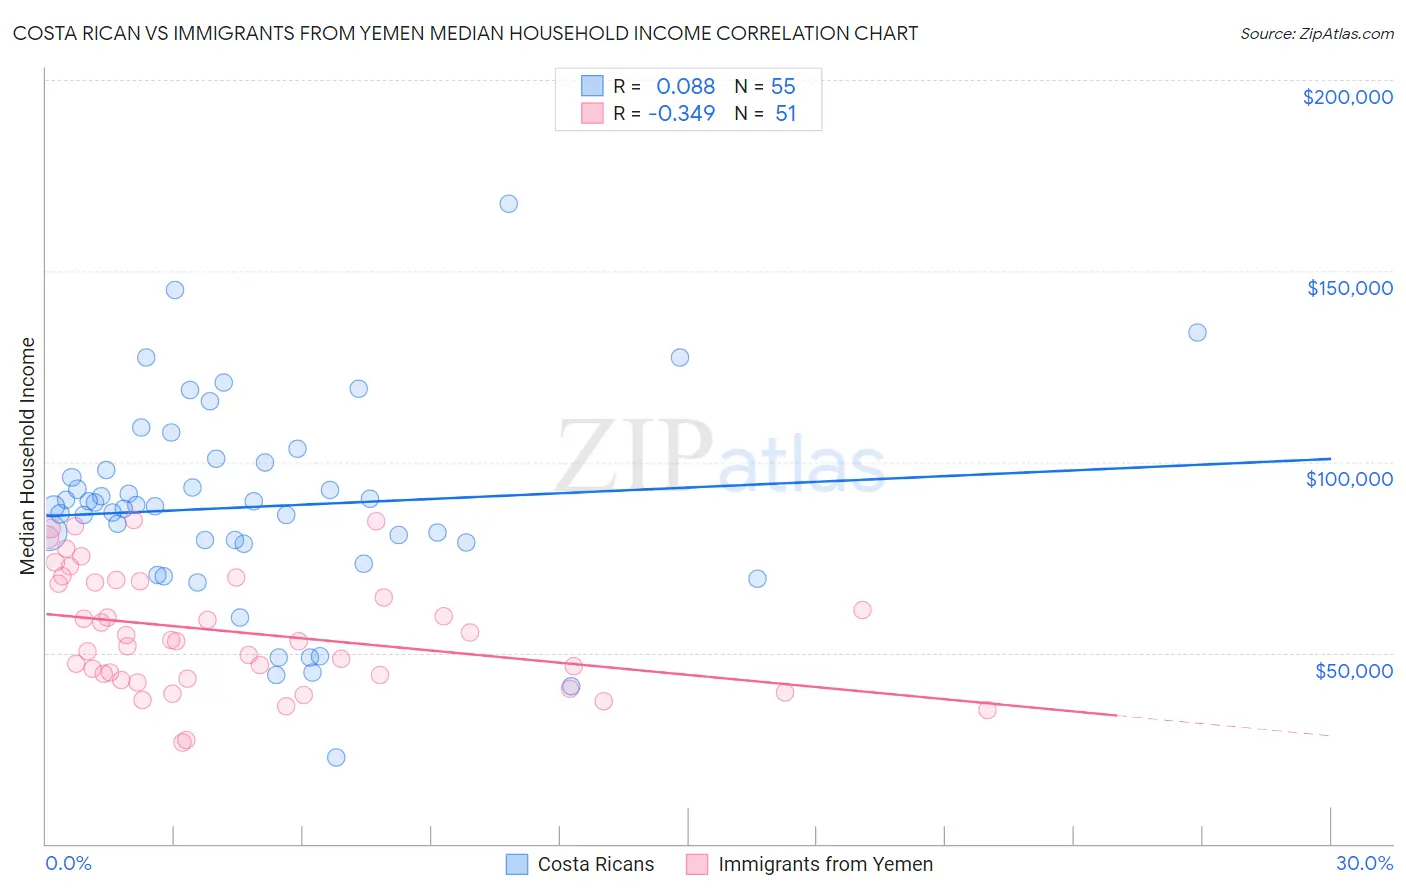
Costa Rican vs Immigrants from Yemen Median Household Income Correlation Chart
The statistical analysis conducted on geographies consisting of 253,413,856 people shows a slight positive correlation between the proportion of Costa Ricans and median household income in the United States with a correlation coefficient (R) of 0.088 and weighted average of $87,262. Similarly, the statistical analysis conducted on geographies consisting of 82,433,611 people shows a mild negative correlation between the proportion of Immigrants from Yemen and median household income in the United States with a correlation coefficient (R) of -0.349 and weighted average of $65,194, a difference of 33.9%.
Median Household Income Correlation Summary
| Measurement | Costa Rican | Immigrants from Yemen |
| Minimum | $22,708 | $26,635 |
| Maximum | $167,647 | $84,689 |
| Range | $144,939 | $58,054 |
| Mean | $88,260 | $55,369 |
| Median | $88,335 | $53,125 |
| Interquartile 25% (IQ1) | $78,591 | $43,348 |
| Interquartile 75% (IQ3) | $99,928 | $68,707 |
| Interquartile Range (IQR) | $21,337 | $25,359 |
| Standard Deviation (Sample) | $26,495 | $15,452 |
| Standard Deviation (Population) | $26,253 | $15,299 |
Similar Demographics by Median Household Income
Demographics Similar to Costa Ricans by Median Household Income
In terms of median household income, the demographic groups most similar to Costa Ricans are South American Indian ($87,446, a difference of 0.21%), Immigrants from Nepal ($87,046, a difference of 0.25%), Basque ($87,001, a difference of 0.30%), Immigrants from Uganda ($87,553, a difference of 0.33%), and Ugandan ($87,557, a difference of 0.34%).
| Demographics | Rating | Rank | Median Household Income |
| Immigrants | Morocco | 86.0 /100 | #141 | Excellent $87,930 |
| Canadians | 84.7 /100 | #142 | Excellent $87,769 |
| Danes | 83.9 /100 | #143 | Excellent $87,676 |
| Serbians | 83.0 /100 | #144 | Excellent $87,572 |
| Ugandans | 82.9 /100 | #145 | Excellent $87,557 |
| Immigrants | Uganda | 82.8 /100 | #146 | Excellent $87,553 |
| South American Indians | 81.8 /100 | #147 | Excellent $87,446 |
| Costa Ricans | 80.0 /100 | #148 | Excellent $87,262 |
| Immigrants | Nepal | 77.7 /100 | #149 | Good $87,046 |
| Basques | 77.2 /100 | #150 | Good $87,001 |
| Hungarians | 76.3 /100 | #151 | Good $86,920 |
| Immigrants | Saudi Arabia | 75.8 /100 | #152 | Good $86,875 |
| South Americans | 75.1 /100 | #153 | Good $86,824 |
| Immigrants | Germany | 74.4 /100 | #154 | Good $86,764 |
| Carpatho Rusyns | 72.8 /100 | #155 | Good $86,635 |
Demographics Similar to Immigrants from Yemen by Median Household Income
In terms of median household income, the demographic groups most similar to Immigrants from Yemen are Hopi ($65,043, a difference of 0.23%), Pueblo ($64,692, a difference of 0.78%), Kiowa ($65,914, a difference of 1.1%), Crow ($63,681, a difference of 2.4%), and Immigrants from Congo ($66,768, a difference of 2.4%).
| Demographics | Rating | Rank | Median Household Income |
| Natives/Alaskans | 0.0 /100 | #331 | Tragic $67,879 |
| Sioux | 0.0 /100 | #332 | Tragic $67,792 |
| Creek | 0.0 /100 | #333 | Tragic $67,715 |
| Blacks/African Americans | 0.0 /100 | #334 | Tragic $67,573 |
| Cheyenne | 0.0 /100 | #335 | Tragic $66,974 |
| Immigrants | Congo | 0.0 /100 | #336 | Tragic $66,768 |
| Kiowa | 0.0 /100 | #337 | Tragic $65,914 |
| Immigrants | Yemen | 0.0 /100 | #338 | Tragic $65,194 |
| Hopi | 0.0 /100 | #339 | Tragic $65,043 |
| Pueblo | 0.0 /100 | #340 | Tragic $64,692 |
| Crow | 0.0 /100 | #341 | Tragic $63,681 |
| Pima | 0.0 /100 | #342 | Tragic $63,262 |
| Houma | 0.0 /100 | #343 | Tragic $62,575 |
| Tohono O'odham | 0.0 /100 | #344 | Tragic $61,663 |
| Puerto Ricans | 0.0 /100 | #345 | Tragic $59,197 |