Laotian vs South African Median Family Income
COMPARE
Laotian
South African
Median Family Income
Median Family Income Comparison
Laotians
South Africans
$112,859
MEDIAN FAMILY INCOME
99.5/ 100
METRIC RATING
73rd/ 347
METRIC RANK
$113,229
MEDIAN FAMILY INCOME
99.5/ 100
METRIC RATING
71st/ 347
METRIC RANK
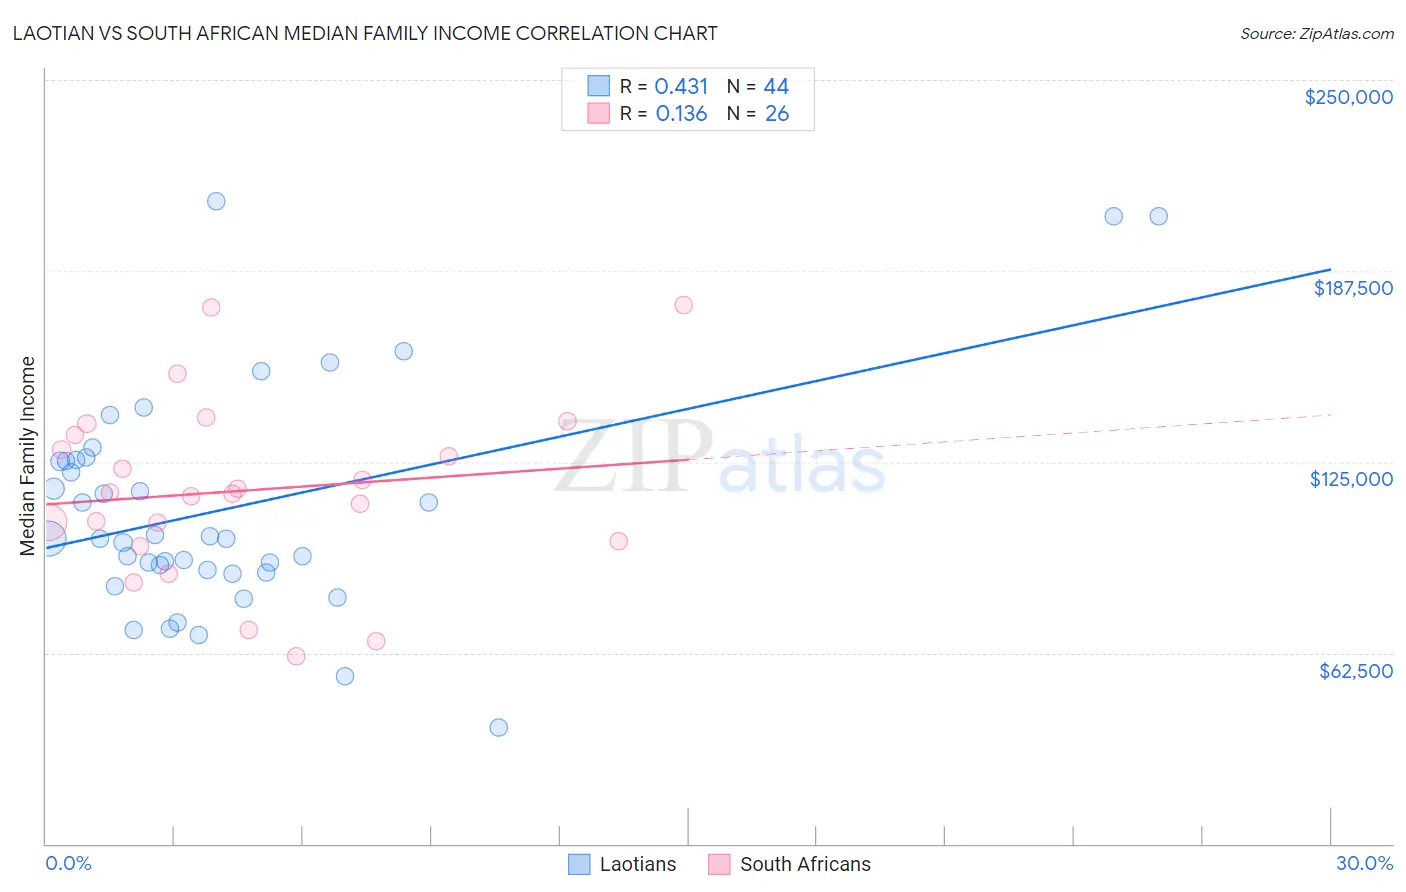
Laotian vs South African Median Family Income Correlation Chart
The statistical analysis conducted on geographies consisting of 224,714,380 people shows a moderate positive correlation between the proportion of Laotians and median family income in the United States with a correlation coefficient (R) of 0.431 and weighted average of $112,859. Similarly, the statistical analysis conducted on geographies consisting of 182,514,560 people shows a poor positive correlation between the proportion of South Africans and median family income in the United States with a correlation coefficient (R) of 0.136 and weighted average of $113,229, a difference of 0.33%.
Median Family Income Correlation Summary
| Measurement | Laotian | South African |
| Minimum | $38,056 | $61,250 |
| Maximum | $210,375 | $176,195 |
| Range | $172,319 | $114,945 |
| Mean | $109,887 | $115,662 |
| Median | $99,824 | $114,722 |
| Interquartile 25% (IQ1) | $89,104 | $99,219 |
| Interquartile 75% (IQ3) | $125,414 | $133,864 |
| Interquartile Range (IQR) | $36,309 | $34,645 |
| Standard Deviation (Sample) | $37,256 | $29,017 |
| Standard Deviation (Population) | $36,830 | $28,454 |
Demographics Similar to Laotians and South Africans by Median Family Income
In terms of median family income, the demographic groups most similar to Laotians are Immigrants from Italy ($112,848, a difference of 0.010%), Afghan ($112,971, a difference of 0.10%), Immigrants from Western Europe ($112,688, a difference of 0.15%), Argentinean ($112,665, a difference of 0.17%), and Immigrants from Eastern Europe ($112,527, a difference of 0.30%). Similarly, the demographic groups most similar to South Africans are Immigrants from Romania ($113,434, a difference of 0.18%), Immigrants from Bulgaria ($113,461, a difference of 0.20%), Immigrants from Serbia ($113,463, a difference of 0.21%), Afghan ($112,971, a difference of 0.23%), and Immigrants from Italy ($112,848, a difference of 0.34%).
| Demographics | Rating | Rank | Median Family Income |
| Mongolians | 99.8 /100 | #62 | Exceptional $114,553 |
| Immigrants | Pakistan | 99.8 /100 | #63 | Exceptional $114,406 |
| Immigrants | Scotland | 99.7 /100 | #64 | Exceptional $114,392 |
| Egyptians | 99.7 /100 | #65 | Exceptional $114,119 |
| Paraguayans | 99.7 /100 | #66 | Exceptional $114,016 |
| Immigrants | Spain | 99.7 /100 | #67 | Exceptional $113,815 |
| Immigrants | Serbia | 99.6 /100 | #68 | Exceptional $113,463 |
| Immigrants | Bulgaria | 99.6 /100 | #69 | Exceptional $113,461 |
| Immigrants | Romania | 99.6 /100 | #70 | Exceptional $113,434 |
| South Africans | 99.5 /100 | #71 | Exceptional $113,229 |
| Afghans | 99.5 /100 | #72 | Exceptional $112,971 |
| Laotians | 99.5 /100 | #73 | Exceptional $112,859 |
| Immigrants | Italy | 99.4 /100 | #74 | Exceptional $112,848 |
| Immigrants | Western Europe | 99.4 /100 | #75 | Exceptional $112,688 |
| Argentineans | 99.4 /100 | #76 | Exceptional $112,665 |
| Immigrants | Eastern Europe | 99.4 /100 | #77 | Exceptional $112,527 |
| Immigrants | Canada | 99.3 /100 | #78 | Exceptional $112,374 |
| Italians | 99.3 /100 | #79 | Exceptional $112,372 |
| Immigrants | Croatia | 99.3 /100 | #80 | Exceptional $112,323 |
| Immigrants | North America | 99.2 /100 | #81 | Exceptional $112,151 |
| Immigrants | England | 99.2 /100 | #82 | Exceptional $112,038 |