Hmong vs Puget Sound Salish Median Family Income
COMPARE
Hmong
Puget Sound Salish
Median Family Income
Median Family Income Comparison
Hmong
Puget Sound Salish
$91,296
MEDIAN FAMILY INCOME
0.3/ 100
METRIC RATING
265th/ 347
METRIC RANK
$97,958
MEDIAN FAMILY INCOME
8.2/ 100
METRIC RATING
210th/ 347
METRIC RANK
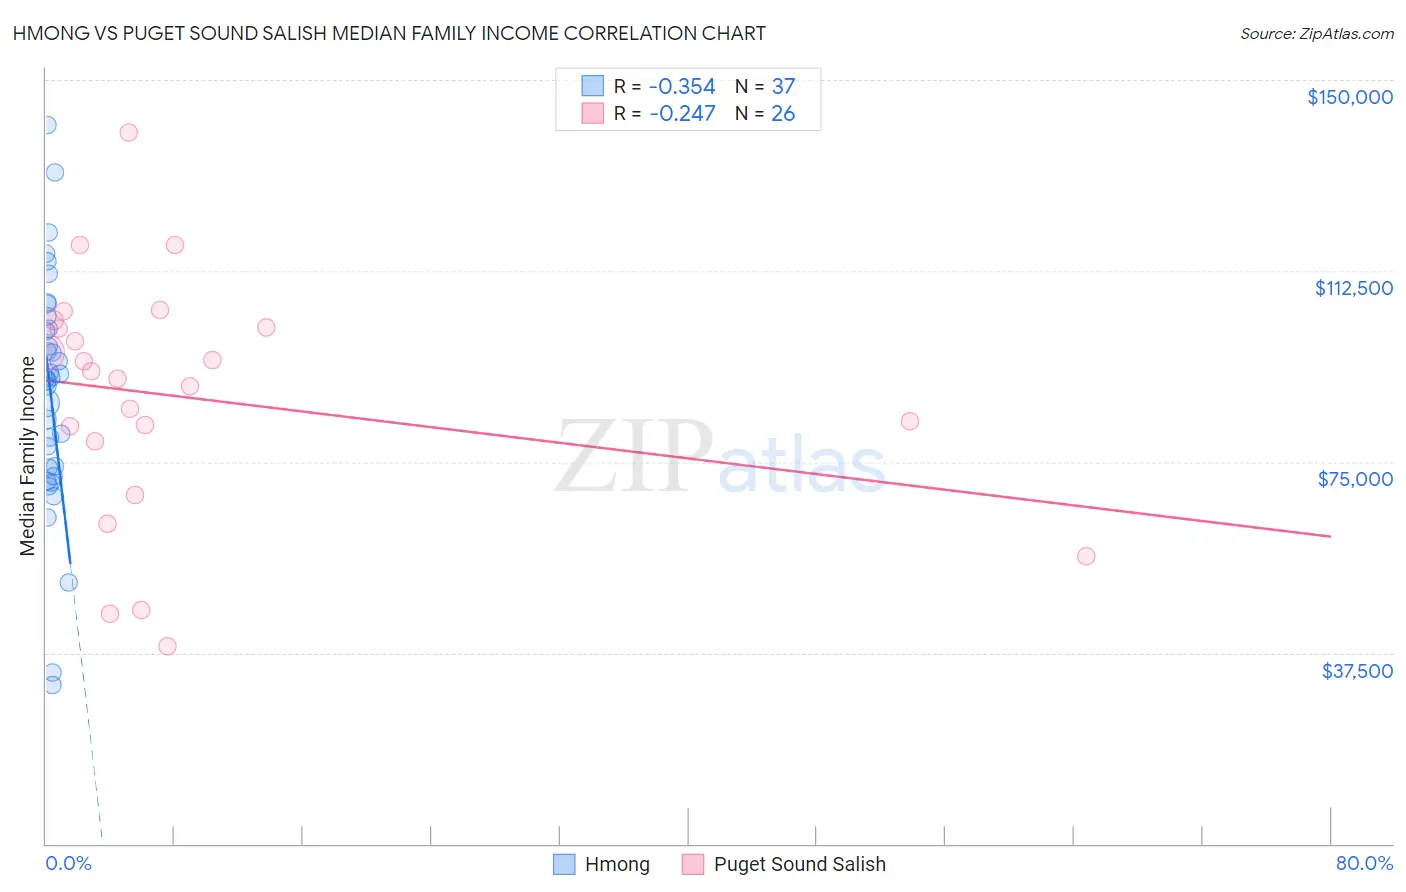
Hmong vs Puget Sound Salish Median Family Income Correlation Chart
The statistical analysis conducted on geographies consisting of 24,655,529 people shows a mild negative correlation between the proportion of Hmong and median family income in the United States with a correlation coefficient (R) of -0.354 and weighted average of $91,296. Similarly, the statistical analysis conducted on geographies consisting of 46,154,605 people shows a weak negative correlation between the proportion of Puget Sound Salish and median family income in the United States with a correlation coefficient (R) of -0.247 and weighted average of $97,958, a difference of 7.3%.
Median Family Income Correlation Summary
| Measurement | Hmong | Puget Sound Salish |
| Minimum | $31,056 | $38,786 |
| Maximum | $141,078 | $139,583 |
| Range | $110,022 | $100,797 |
| Mean | $88,552 | $87,625 |
| Median | $91,363 | $92,122 |
| Interquartile 25% (IQ1) | $73,027 | $79,101 |
| Interquartile 75% (IQ3) | $102,409 | $101,382 |
| Interquartile Range (IQR) | $29,382 | $22,281 |
| Standard Deviation (Sample) | $23,412 | $23,723 |
| Standard Deviation (Population) | $23,093 | $23,263 |
Similar Demographics by Median Family Income
Demographics Similar to Hmong by Median Family Income
In terms of median family income, the demographic groups most similar to Hmong are Senegalese ($91,475, a difference of 0.20%), Central American ($91,087, a difference of 0.23%), Immigrants from West Indies ($91,588, a difference of 0.32%), Mexican American Indian ($90,918, a difference of 0.42%), and Cree ($90,882, a difference of 0.46%).
| Demographics | Rating | Rank | Median Family Income |
| Osage | 0.4 /100 | #258 | Tragic $91,926 |
| Cape Verdeans | 0.4 /100 | #259 | Tragic $91,848 |
| Pennsylvania Germans | 0.4 /100 | #260 | Tragic $91,763 |
| Inupiat | 0.4 /100 | #261 | Tragic $91,730 |
| Liberians | 0.4 /100 | #262 | Tragic $91,722 |
| Immigrants | West Indies | 0.3 /100 | #263 | Tragic $91,588 |
| Senegalese | 0.3 /100 | #264 | Tragic $91,475 |
| Hmong | 0.3 /100 | #265 | Tragic $91,296 |
| Central Americans | 0.3 /100 | #266 | Tragic $91,087 |
| Mexican American Indians | 0.2 /100 | #267 | Tragic $90,918 |
| Cree | 0.2 /100 | #268 | Tragic $90,882 |
| Belizeans | 0.2 /100 | #269 | Tragic $90,880 |
| Jamaicans | 0.2 /100 | #270 | Tragic $90,581 |
| Iroquois | 0.2 /100 | #271 | Tragic $90,543 |
| Immigrants | Liberia | 0.2 /100 | #272 | Tragic $90,450 |
Demographics Similar to Puget Sound Salish by Median Family Income
In terms of median family income, the demographic groups most similar to Puget Sound Salish are Immigrants from Colombia ($98,067, a difference of 0.11%), Immigrants from Sudan ($97,737, a difference of 0.23%), Immigrants from Uruguay ($98,205, a difference of 0.25%), Panamanian ($97,683, a difference of 0.28%), and Immigrants from Armenia ($97,605, a difference of 0.36%).
| Demographics | Rating | Rank | Median Family Income |
| Scotch-Irish | 17.1 /100 | #203 | Poor $99,591 |
| Ghanaians | 12.6 /100 | #204 | Poor $98,877 |
| Hawaiians | 12.5 /100 | #205 | Poor $98,869 |
| Immigrants | Iraq | 12.1 /100 | #206 | Poor $98,786 |
| Aleuts | 11.6 /100 | #207 | Poor $98,702 |
| Immigrants | Uruguay | 9.2 /100 | #208 | Tragic $98,205 |
| Immigrants | Colombia | 8.7 /100 | #209 | Tragic $98,067 |
| Puget Sound Salish | 8.2 /100 | #210 | Tragic $97,958 |
| Immigrants | Sudan | 7.4 /100 | #211 | Tragic $97,737 |
| Panamanians | 7.2 /100 | #212 | Tragic $97,683 |
| Immigrants | Armenia | 7.0 /100 | #213 | Tragic $97,605 |
| Bermudans | 6.9 /100 | #214 | Tragic $97,577 |
| Nigerians | 6.7 /100 | #215 | Tragic $97,522 |
| Immigrants | Bosnia and Herzegovina | 6.4 /100 | #216 | Tragic $97,432 |
| Japanese | 6.0 /100 | #217 | Tragic $97,288 |