Subsaharan African vs Puget Sound Salish Median Family Income
COMPARE
Subsaharan African
Puget Sound Salish
Median Family Income
Median Family Income Comparison
Sub-Saharan Africans
Puget Sound Salish
$93,748
MEDIAN FAMILY INCOME
1.0/ 100
METRIC RATING
244th/ 347
METRIC RANK
$97,958
MEDIAN FAMILY INCOME
8.2/ 100
METRIC RATING
210th/ 347
METRIC RANK
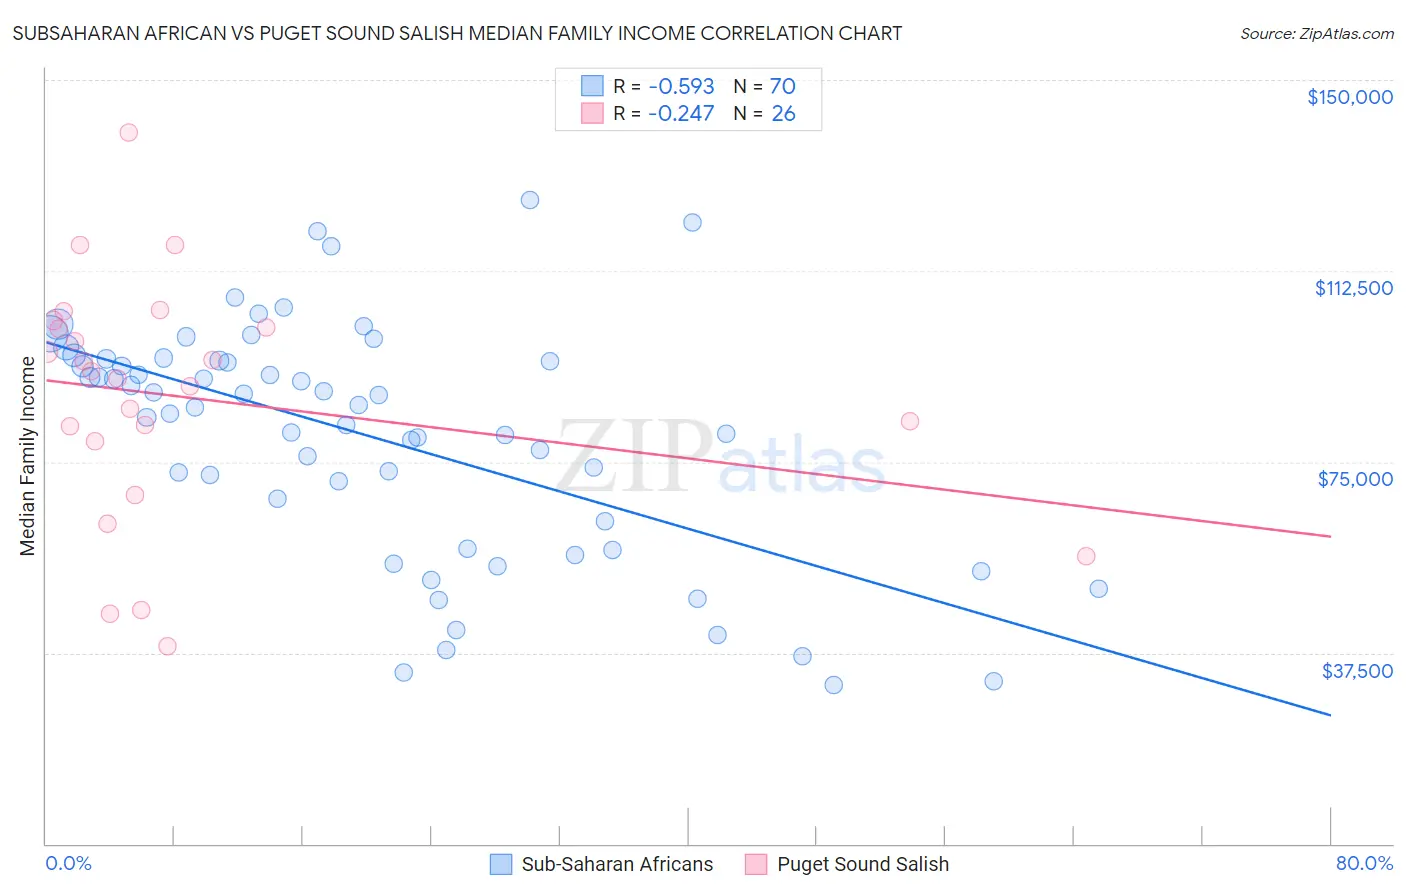
Subsaharan African vs Puget Sound Salish Median Family Income Correlation Chart
The statistical analysis conducted on geographies consisting of 507,233,451 people shows a substantial negative correlation between the proportion of Sub-Saharan Africans and median family income in the United States with a correlation coefficient (R) of -0.593 and weighted average of $93,748. Similarly, the statistical analysis conducted on geographies consisting of 46,154,605 people shows a weak negative correlation between the proportion of Puget Sound Salish and median family income in the United States with a correlation coefficient (R) of -0.247 and weighted average of $97,958, a difference of 4.5%.
Median Family Income Correlation Summary
| Measurement | Subsaharan African | Puget Sound Salish |
| Minimum | $31,084 | $38,786 |
| Maximum | $126,507 | $139,583 |
| Range | $95,423 | $100,797 |
| Mean | $80,060 | $87,625 |
| Median | $85,890 | $92,122 |
| Interquartile 25% (IQ1) | $63,281 | $79,101 |
| Interquartile 75% (IQ3) | $94,886 | $101,382 |
| Interquartile Range (IQR) | $31,605 | $22,281 |
| Standard Deviation (Sample) | $22,942 | $23,723 |
| Standard Deviation (Population) | $22,778 | $23,263 |
Similar Demographics by Median Family Income
Demographics Similar to Sub-Saharan Africans by Median Family Income
In terms of median family income, the demographic groups most similar to Sub-Saharan Africans are German Russian ($93,858, a difference of 0.12%), Immigrants from Middle Africa ($93,593, a difference of 0.17%), Barbadian ($93,919, a difference of 0.18%), Immigrants from Trinidad and Tobago ($93,988, a difference of 0.26%), and Somali ($94,085, a difference of 0.36%).
| Demographics | Rating | Rank | Median Family Income |
| Alaskan Athabascans | 1.5 /100 | #237 | Tragic $94,429 |
| Nepalese | 1.3 /100 | #238 | Tragic $94,153 |
| Salvadorans | 1.2 /100 | #239 | Tragic $94,109 |
| Somalis | 1.2 /100 | #240 | Tragic $94,085 |
| Immigrants | Trinidad and Tobago | 1.2 /100 | #241 | Tragic $93,988 |
| Barbadians | 1.1 /100 | #242 | Tragic $93,919 |
| German Russians | 1.1 /100 | #243 | Tragic $93,858 |
| Sub-Saharan Africans | 1.0 /100 | #244 | Tragic $93,748 |
| Immigrants | Middle Africa | 1.0 /100 | #245 | Tragic $93,593 |
| Guyanese | 0.9 /100 | #246 | Tragic $93,373 |
| Immigrants | Senegal | 0.7 /100 | #247 | Tragic $92,912 |
| French American Indians | 0.7 /100 | #248 | Tragic $92,872 |
| Immigrants | Ecuador | 0.7 /100 | #249 | Tragic $92,837 |
| West Indians | 0.6 /100 | #250 | Tragic $92,765 |
| Immigrants | Somalia | 0.6 /100 | #251 | Tragic $92,609 |
Demographics Similar to Puget Sound Salish by Median Family Income
In terms of median family income, the demographic groups most similar to Puget Sound Salish are Immigrants from Colombia ($98,067, a difference of 0.11%), Immigrants from Sudan ($97,737, a difference of 0.23%), Immigrants from Uruguay ($98,205, a difference of 0.25%), Panamanian ($97,683, a difference of 0.28%), and Immigrants from Armenia ($97,605, a difference of 0.36%).
| Demographics | Rating | Rank | Median Family Income |
| Scotch-Irish | 17.1 /100 | #203 | Poor $99,591 |
| Ghanaians | 12.6 /100 | #204 | Poor $98,877 |
| Hawaiians | 12.5 /100 | #205 | Poor $98,869 |
| Immigrants | Iraq | 12.1 /100 | #206 | Poor $98,786 |
| Aleuts | 11.6 /100 | #207 | Poor $98,702 |
| Immigrants | Uruguay | 9.2 /100 | #208 | Tragic $98,205 |
| Immigrants | Colombia | 8.7 /100 | #209 | Tragic $98,067 |
| Puget Sound Salish | 8.2 /100 | #210 | Tragic $97,958 |
| Immigrants | Sudan | 7.4 /100 | #211 | Tragic $97,737 |
| Panamanians | 7.2 /100 | #212 | Tragic $97,683 |
| Immigrants | Armenia | 7.0 /100 | #213 | Tragic $97,605 |
| Bermudans | 6.9 /100 | #214 | Tragic $97,577 |
| Nigerians | 6.7 /100 | #215 | Tragic $97,522 |
| Immigrants | Bosnia and Herzegovina | 6.4 /100 | #216 | Tragic $97,432 |
| Japanese | 6.0 /100 | #217 | Tragic $97,288 |