Eastern European vs Immigrants from Sri Lanka Median Male Earnings
COMPARE
Eastern European
Immigrants from Sri Lanka
Median Male Earnings
Median Male Earnings Comparison
Eastern Europeans
Immigrants from Sri Lanka
$66,472
MEDIAN MALE EARNINGS
100.0/ 100
METRIC RATING
16th/ 347
METRIC RANK
$63,099
MEDIAN MALE EARNINGS
100.0/ 100
METRIC RATING
37th/ 347
METRIC RANK
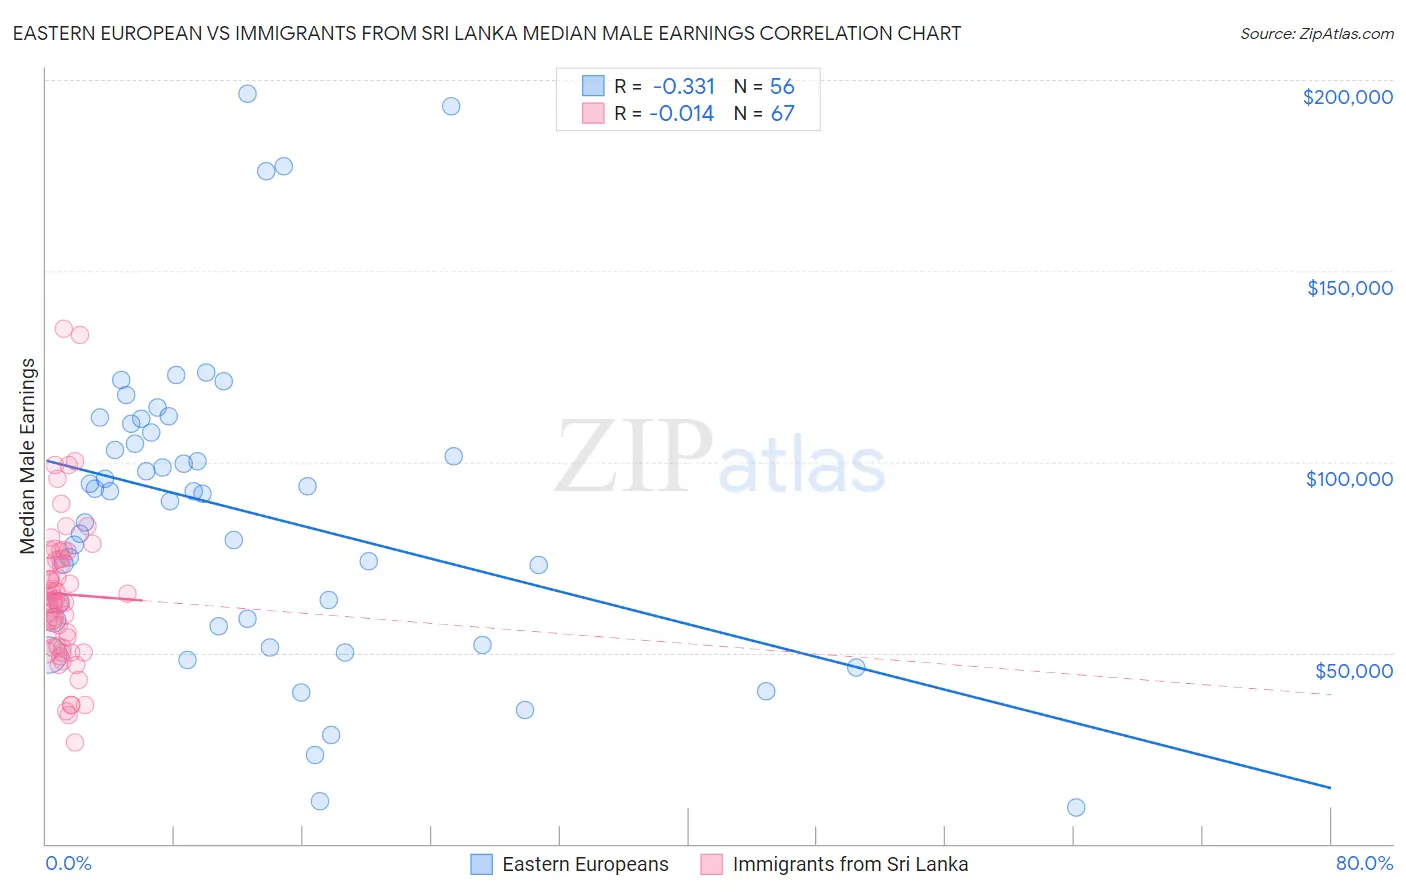
Eastern European vs Immigrants from Sri Lanka Median Male Earnings Correlation Chart
The statistical analysis conducted on geographies consisting of 460,960,346 people shows a mild negative correlation between the proportion of Eastern Europeans and median male earnings in the United States with a correlation coefficient (R) of -0.331 and weighted average of $66,472. Similarly, the statistical analysis conducted on geographies consisting of 149,678,305 people shows no correlation between the proportion of Immigrants from Sri Lanka and median male earnings in the United States with a correlation coefficient (R) of -0.014 and weighted average of $63,099, a difference of 5.3%.
Median Male Earnings Correlation Summary
| Measurement | Eastern European | Immigrants from Sri Lanka |
| Minimum | $9,364 | $26,357 |
| Maximum | $196,250 | $134,837 |
| Range | $186,886 | $108,480 |
| Mean | $86,901 | $65,375 |
| Median | $91,970 | $63,858 |
| Interquartile 25% (IQ1) | $57,711 | $51,338 |
| Interquartile 75% (IQ3) | $108,812 | $74,628 |
| Interquartile Range (IQR) | $51,101 | $23,290 |
| Standard Deviation (Sample) | $40,387 | $20,034 |
| Standard Deviation (Population) | $40,024 | $19,884 |
Similar Demographics by Median Male Earnings
Demographics Similar to Eastern Europeans by Median Male Earnings
In terms of median male earnings, the demographic groups most similar to Eastern Europeans are Immigrants from Belgium ($66,125, a difference of 0.53%), Indian (Asian) ($66,078, a difference of 0.60%), Immigrants from Eastern Asia ($66,903, a difference of 0.65%), Okinawan ($67,232, a difference of 1.1%), and Immigrants from China ($67,353, a difference of 1.3%).
| Demographics | Rating | Rank | Median Male Earnings |
| Immigrants | South Central Asia | 100.0 /100 | #9 | Exceptional $68,960 |
| Immigrants | Israel | 100.0 /100 | #10 | Exceptional $68,716 |
| Immigrants | Ireland | 100.0 /100 | #11 | Exceptional $67,698 |
| Immigrants | Australia | 100.0 /100 | #12 | Exceptional $67,634 |
| Immigrants | China | 100.0 /100 | #13 | Exceptional $67,353 |
| Okinawans | 100.0 /100 | #14 | Exceptional $67,232 |
| Immigrants | Eastern Asia | 100.0 /100 | #15 | Exceptional $66,903 |
| Eastern Europeans | 100.0 /100 | #16 | Exceptional $66,472 |
| Immigrants | Belgium | 100.0 /100 | #17 | Exceptional $66,125 |
| Indians (Asian) | 100.0 /100 | #18 | Exceptional $66,078 |
| Cypriots | 100.0 /100 | #19 | Exceptional $65,549 |
| Immigrants | Japan | 100.0 /100 | #20 | Exceptional $65,518 |
| Immigrants | Sweden | 100.0 /100 | #21 | Exceptional $65,406 |
| Burmese | 100.0 /100 | #22 | Exceptional $65,236 |
| Immigrants | Korea | 100.0 /100 | #23 | Exceptional $65,079 |
Demographics Similar to Immigrants from Sri Lanka by Median Male Earnings
In terms of median male earnings, the demographic groups most similar to Immigrants from Sri Lanka are Israeli ($63,228, a difference of 0.20%), Immigrants from Asia ($63,240, a difference of 0.22%), Maltese ($62,953, a difference of 0.23%), Immigrants from South Africa ($62,899, a difference of 0.32%), and Immigrants from Russia ($63,326, a difference of 0.36%).
| Demographics | Rating | Rank | Median Male Earnings |
| Immigrants | France | 100.0 /100 | #30 | Exceptional $63,715 |
| Latvians | 100.0 /100 | #31 | Exceptional $63,498 |
| Soviet Union | 100.0 /100 | #32 | Exceptional $63,382 |
| Immigrants | Lithuania | 100.0 /100 | #33 | Exceptional $63,346 |
| Immigrants | Russia | 100.0 /100 | #34 | Exceptional $63,326 |
| Immigrants | Asia | 100.0 /100 | #35 | Exceptional $63,240 |
| Israelis | 100.0 /100 | #36 | Exceptional $63,228 |
| Immigrants | Sri Lanka | 100.0 /100 | #37 | Exceptional $63,099 |
| Maltese | 100.0 /100 | #38 | Exceptional $62,953 |
| Immigrants | South Africa | 100.0 /100 | #39 | Exceptional $62,899 |
| Australians | 100.0 /100 | #40 | Exceptional $62,857 |
| Immigrants | Turkey | 100.0 /100 | #41 | Exceptional $62,728 |
| Immigrants | Greece | 100.0 /100 | #42 | Exceptional $62,689 |
| Immigrants | Belarus | 100.0 /100 | #43 | Exceptional $62,658 |
| Cambodians | 100.0 /100 | #44 | Exceptional $62,516 |