Dutch vs Sioux Median Household Income
COMPARE
Dutch
Sioux
Median Household Income
Median Household Income Comparison
Dutch
Sioux
$82,971
MEDIAN HOUSEHOLD INCOME
20.3/ 100
METRIC RATING
207th/ 347
METRIC RANK
$67,792
MEDIAN HOUSEHOLD INCOME
0.0/ 100
METRIC RATING
332nd/ 347
METRIC RANK
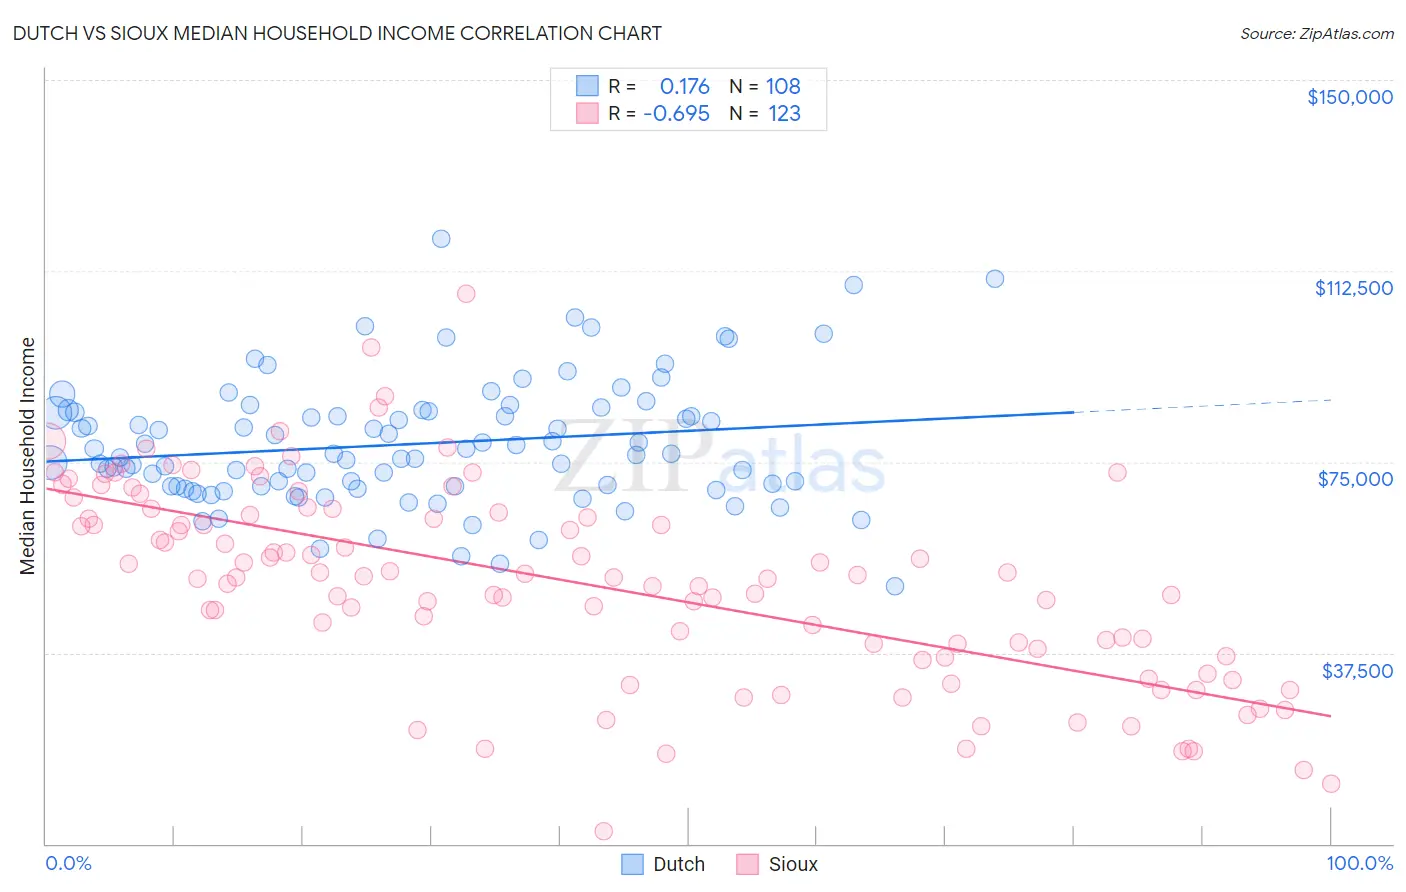
Dutch vs Sioux Median Household Income Correlation Chart
The statistical analysis conducted on geographies consisting of 553,516,868 people shows a poor positive correlation between the proportion of Dutch and median household income in the United States with a correlation coefficient (R) of 0.176 and weighted average of $82,971. Similarly, the statistical analysis conducted on geographies consisting of 234,052,794 people shows a significant negative correlation between the proportion of Sioux and median household income in the United States with a correlation coefficient (R) of -0.695 and weighted average of $67,792, a difference of 22.4%.
Median Household Income Correlation Summary
| Measurement | Dutch | Sioux |
| Minimum | $50,679 | $2,499 |
| Maximum | $118,750 | $108,000 |
| Range | $68,071 | $105,501 |
| Mean | $78,501 | $51,141 |
| Median | $76,487 | $52,399 |
| Interquartile 25% (IQ1) | $70,197 | $36,923 |
| Interquartile 75% (IQ3) | $84,813 | $65,000 |
| Interquartile Range (IQR) | $14,616 | $28,077 |
| Standard Deviation (Sample) | $12,272 | $19,497 |
| Standard Deviation (Population) | $12,215 | $19,417 |
Similar Demographics by Median Household Income
Demographics Similar to Dutch by Median Household Income
In terms of median household income, the demographic groups most similar to Dutch are Immigrants from Kenya ($83,068, a difference of 0.12%), French Canadian ($82,810, a difference of 0.19%), Celtic ($83,193, a difference of 0.27%), Immigrants from Africa ($83,289, a difference of 0.38%), and Immigrants from Cambodia ($83,304, a difference of 0.40%).
| Demographics | Rating | Rank | Median Household Income |
| Tsimshian | 24.5 /100 | #200 | Fair $83,346 |
| Spanish | 24.4 /100 | #201 | Fair $83,343 |
| Immigrants | Thailand | 24.3 /100 | #202 | Fair $83,327 |
| Immigrants | Cambodia | 24.0 /100 | #203 | Fair $83,304 |
| Immigrants | Africa | 23.8 /100 | #204 | Fair $83,289 |
| Celtics | 22.7 /100 | #205 | Fair $83,193 |
| Immigrants | Kenya | 21.3 /100 | #206 | Fair $83,068 |
| Dutch | 20.3 /100 | #207 | Fair $82,971 |
| French Canadians | 18.7 /100 | #208 | Poor $82,810 |
| Immigrants | Iraq | 16.7 /100 | #209 | Poor $82,594 |
| Immigrants | Uruguay | 16.4 /100 | #210 | Poor $82,560 |
| Salvadorans | 15.4 /100 | #211 | Poor $82,449 |
| Venezuelans | 15.3 /100 | #212 | Poor $82,432 |
| Nepalese | 15.1 /100 | #213 | Poor $82,410 |
| Panamanians | 14.0 /100 | #214 | Poor $82,272 |
Demographics Similar to Sioux by Median Household Income
In terms of median household income, the demographic groups most similar to Sioux are Creek ($67,715, a difference of 0.11%), Native/Alaskan ($67,879, a difference of 0.13%), Arapaho ($67,965, a difference of 0.25%), Black/African American ($67,573, a difference of 0.32%), and Dutch West Indian ($68,412, a difference of 0.91%).
| Demographics | Rating | Rank | Median Household Income |
| Seminole | 0.0 /100 | #325 | Tragic $69,420 |
| Yuman | 0.0 /100 | #326 | Tragic $68,743 |
| Immigrants | Cuba | 0.0 /100 | #327 | Tragic $68,461 |
| Menominee | 0.0 /100 | #328 | Tragic $68,423 |
| Dutch West Indians | 0.0 /100 | #329 | Tragic $68,412 |
| Arapaho | 0.0 /100 | #330 | Tragic $67,965 |
| Natives/Alaskans | 0.0 /100 | #331 | Tragic $67,879 |
| Sioux | 0.0 /100 | #332 | Tragic $67,792 |
| Creek | 0.0 /100 | #333 | Tragic $67,715 |
| Blacks/African Americans | 0.0 /100 | #334 | Tragic $67,573 |
| Cheyenne | 0.0 /100 | #335 | Tragic $66,974 |
| Immigrants | Congo | 0.0 /100 | #336 | Tragic $66,768 |
| Kiowa | 0.0 /100 | #337 | Tragic $65,914 |
| Immigrants | Yemen | 0.0 /100 | #338 | Tragic $65,194 |
| Hopi | 0.0 /100 | #339 | Tragic $65,043 |