Cheyenne vs Sioux Median Household Income
COMPARE
Cheyenne
Sioux
Median Household Income
Median Household Income Comparison
Cheyenne
Sioux
$66,974
MEDIAN HOUSEHOLD INCOME
0.0/ 100
METRIC RATING
335th/ 347
METRIC RANK
$67,792
MEDIAN HOUSEHOLD INCOME
0.0/ 100
METRIC RATING
332nd/ 347
METRIC RANK
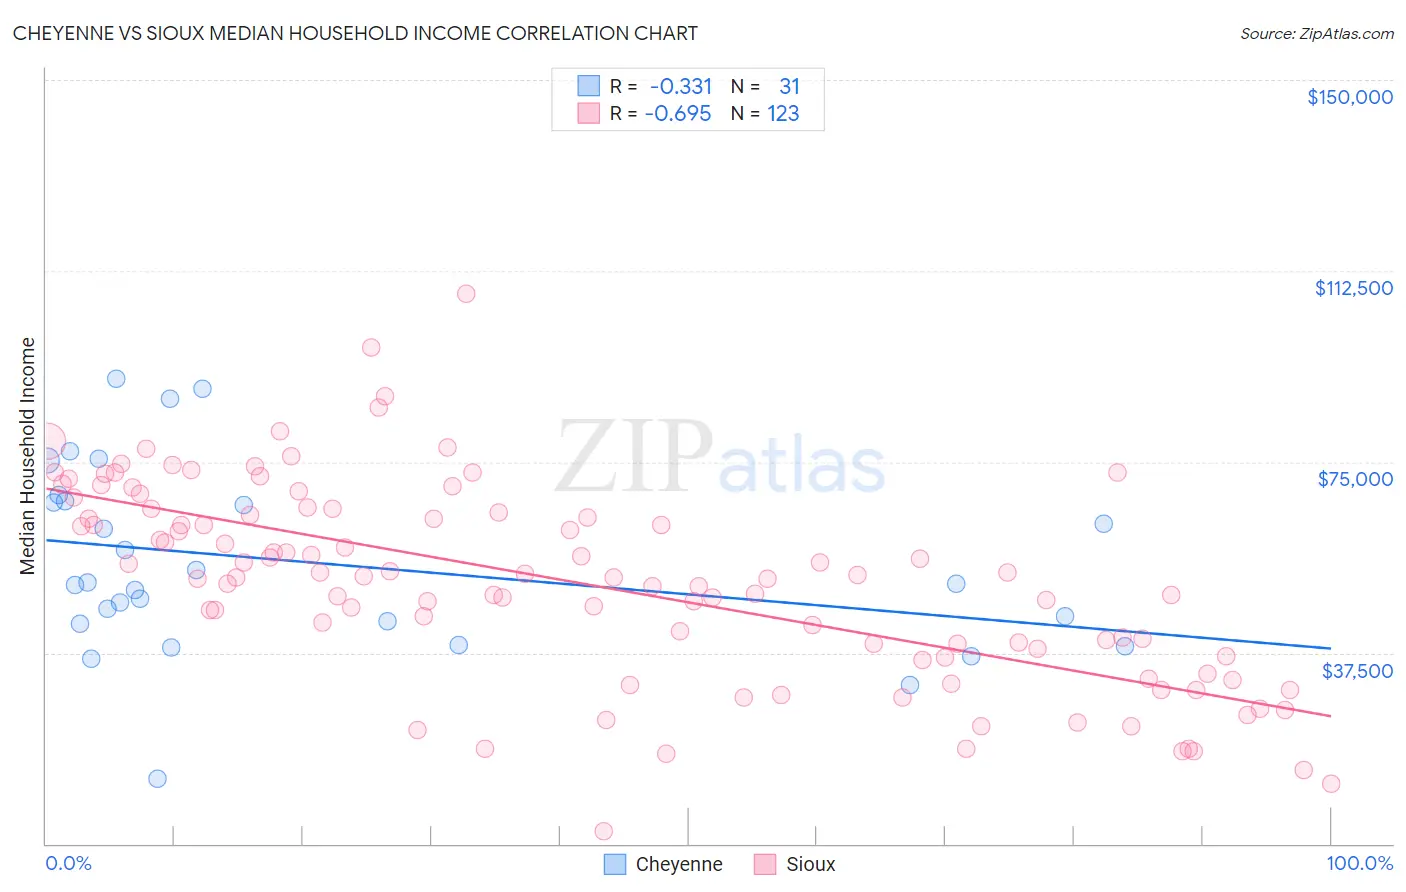
Cheyenne vs Sioux Median Household Income Correlation Chart
The statistical analysis conducted on geographies consisting of 80,700,473 people shows a mild negative correlation between the proportion of Cheyenne and median household income in the United States with a correlation coefficient (R) of -0.331 and weighted average of $66,974. Similarly, the statistical analysis conducted on geographies consisting of 234,052,794 people shows a significant negative correlation between the proportion of Sioux and median household income in the United States with a correlation coefficient (R) of -0.695 and weighted average of $67,792, a difference of 1.2%.
Median Household Income Correlation Summary
| Measurement | Cheyenne | Sioux |
| Minimum | $12,708 | $2,499 |
| Maximum | $91,250 | $108,000 |
| Range | $78,542 | $105,501 |
| Mean | $55,202 | $51,141 |
| Median | $51,125 | $52,399 |
| Interquartile 25% (IQ1) | $43,228 | $36,923 |
| Interquartile 75% (IQ3) | $67,262 | $65,000 |
| Interquartile Range (IQR) | $24,034 | $28,077 |
| Standard Deviation (Sample) | $18,300 | $19,497 |
| Standard Deviation (Population) | $18,003 | $19,417 |
Demographics Similar to Cheyenne and Sioux by Median Household Income
In terms of median household income, the demographic groups most similar to Cheyenne are Immigrants from Congo ($66,768, a difference of 0.31%), Black/African American ($67,573, a difference of 0.89%), Creek ($67,715, a difference of 1.1%), Native/Alaskan ($67,879, a difference of 1.3%), and Arapaho ($67,965, a difference of 1.5%). Similarly, the demographic groups most similar to Sioux are Creek ($67,715, a difference of 0.11%), Native/Alaskan ($67,879, a difference of 0.13%), Arapaho ($67,965, a difference of 0.25%), Black/African American ($67,573, a difference of 0.32%), and Dutch West Indian ($68,412, a difference of 0.91%).
| Demographics | Rating | Rank | Median Household Income |
| Bahamians | 0.0 /100 | #323 | Tragic $69,726 |
| Yup'ik | 0.0 /100 | #324 | Tragic $69,695 |
| Seminole | 0.0 /100 | #325 | Tragic $69,420 |
| Yuman | 0.0 /100 | #326 | Tragic $68,743 |
| Immigrants | Cuba | 0.0 /100 | #327 | Tragic $68,461 |
| Menominee | 0.0 /100 | #328 | Tragic $68,423 |
| Dutch West Indians | 0.0 /100 | #329 | Tragic $68,412 |
| Arapaho | 0.0 /100 | #330 | Tragic $67,965 |
| Natives/Alaskans | 0.0 /100 | #331 | Tragic $67,879 |
| Sioux | 0.0 /100 | #332 | Tragic $67,792 |
| Creek | 0.0 /100 | #333 | Tragic $67,715 |
| Blacks/African Americans | 0.0 /100 | #334 | Tragic $67,573 |
| Cheyenne | 0.0 /100 | #335 | Tragic $66,974 |
| Immigrants | Congo | 0.0 /100 | #336 | Tragic $66,768 |
| Kiowa | 0.0 /100 | #337 | Tragic $65,914 |
| Immigrants | Yemen | 0.0 /100 | #338 | Tragic $65,194 |
| Hopi | 0.0 /100 | #339 | Tragic $65,043 |
| Pueblo | 0.0 /100 | #340 | Tragic $64,692 |
| Crow | 0.0 /100 | #341 | Tragic $63,681 |
| Pima | 0.0 /100 | #342 | Tragic $63,262 |
| Houma | 0.0 /100 | #343 | Tragic $62,575 |