Dutch vs Immigrants from Fiji Median Household Income
COMPARE
Dutch
Immigrants from Fiji
Median Household Income
Median Household Income Comparison
Dutch
Immigrants from Fiji
$82,971
MEDIAN HOUSEHOLD INCOME
20.3/ 100
METRIC RATING
207th/ 347
METRIC RANK
$93,933
MEDIAN HOUSEHOLD INCOME
99.7/ 100
METRIC RATING
70th/ 347
METRIC RANK
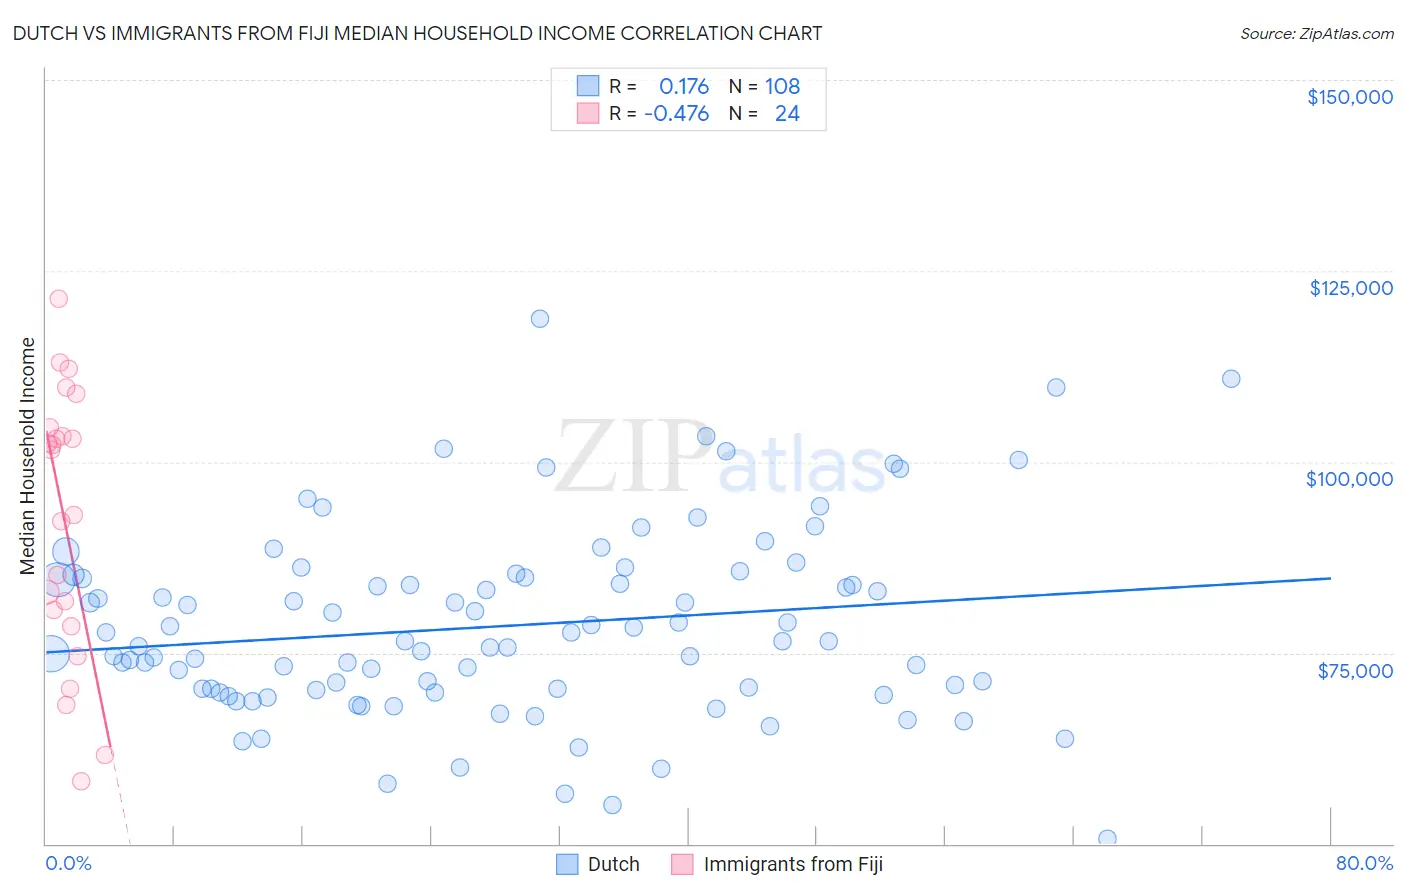
Dutch vs Immigrants from Fiji Median Household Income Correlation Chart
The statistical analysis conducted on geographies consisting of 553,516,868 people shows a poor positive correlation between the proportion of Dutch and median household income in the United States with a correlation coefficient (R) of 0.176 and weighted average of $82,971. Similarly, the statistical analysis conducted on geographies consisting of 93,754,169 people shows a moderate negative correlation between the proportion of Immigrants from Fiji and median household income in the United States with a correlation coefficient (R) of -0.476 and weighted average of $93,933, a difference of 13.2%.
Median Household Income Correlation Summary
| Measurement | Dutch | Immigrants from Fiji |
| Minimum | $50,679 | $58,122 |
| Maximum | $118,750 | $121,408 |
| Range | $68,071 | $63,286 |
| Mean | $78,501 | $92,206 |
| Median | $76,487 | $97,285 |
| Interquartile 25% (IQ1) | $70,197 | $79,580 |
| Interquartile 75% (IQ3) | $84,813 | $103,956 |
| Interquartile Range (IQR) | $14,616 | $24,377 |
| Standard Deviation (Sample) | $12,272 | $17,579 |
| Standard Deviation (Population) | $12,215 | $17,209 |
Similar Demographics by Median Household Income
Demographics Similar to Dutch by Median Household Income
In terms of median household income, the demographic groups most similar to Dutch are Immigrants from Kenya ($83,068, a difference of 0.12%), French Canadian ($82,810, a difference of 0.19%), Celtic ($83,193, a difference of 0.27%), Immigrants from Africa ($83,289, a difference of 0.38%), and Immigrants from Cambodia ($83,304, a difference of 0.40%).
| Demographics | Rating | Rank | Median Household Income |
| Tsimshian | 24.5 /100 | #200 | Fair $83,346 |
| Spanish | 24.4 /100 | #201 | Fair $83,343 |
| Immigrants | Thailand | 24.3 /100 | #202 | Fair $83,327 |
| Immigrants | Cambodia | 24.0 /100 | #203 | Fair $83,304 |
| Immigrants | Africa | 23.8 /100 | #204 | Fair $83,289 |
| Celtics | 22.7 /100 | #205 | Fair $83,193 |
| Immigrants | Kenya | 21.3 /100 | #206 | Fair $83,068 |
| Dutch | 20.3 /100 | #207 | Fair $82,971 |
| French Canadians | 18.7 /100 | #208 | Poor $82,810 |
| Immigrants | Iraq | 16.7 /100 | #209 | Poor $82,594 |
| Immigrants | Uruguay | 16.4 /100 | #210 | Poor $82,560 |
| Salvadorans | 15.4 /100 | #211 | Poor $82,449 |
| Venezuelans | 15.3 /100 | #212 | Poor $82,432 |
| Nepalese | 15.1 /100 | #213 | Poor $82,410 |
| Panamanians | 14.0 /100 | #214 | Poor $82,272 |
Demographics Similar to Immigrants from Fiji by Median Household Income
In terms of median household income, the demographic groups most similar to Immigrants from Fiji are Argentinean ($93,960, a difference of 0.030%), Mongolian ($93,971, a difference of 0.040%), Immigrants from Philippines ($93,899, a difference of 0.040%), Lithuanian ($93,852, a difference of 0.090%), and Immigrants from Scotland ($94,091, a difference of 0.17%).
| Demographics | Rating | Rank | Median Household Income |
| Greeks | 99.8 /100 | #63 | Exceptional $94,735 |
| Immigrants | Netherlands | 99.7 /100 | #64 | Exceptional $94,411 |
| Immigrants | Belarus | 99.7 /100 | #65 | Exceptional $94,399 |
| Immigrants | Romania | 99.7 /100 | #66 | Exceptional $94,222 |
| Immigrants | Scotland | 99.7 /100 | #67 | Exceptional $94,091 |
| Mongolians | 99.7 /100 | #68 | Exceptional $93,971 |
| Argentineans | 99.7 /100 | #69 | Exceptional $93,960 |
| Immigrants | Fiji | 99.7 /100 | #70 | Exceptional $93,933 |
| Immigrants | Philippines | 99.6 /100 | #71 | Exceptional $93,899 |
| Lithuanians | 99.6 /100 | #72 | Exceptional $93,852 |
| Immigrants | Egypt | 99.6 /100 | #73 | Exceptional $93,700 |
| Immigrants | Latvia | 99.6 /100 | #74 | Exceptional $93,602 |
| Immigrants | Italy | 99.5 /100 | #75 | Exceptional $93,465 |
| South Africans | 99.5 /100 | #76 | Exceptional $93,379 |
| Immigrants | Afghanistan | 99.5 /100 | #77 | Exceptional $93,375 |