Dutch vs Sioux No Schooling Completed
COMPARE
Dutch
Sioux
No Schooling Completed
No Schooling Completed Comparison
Dutch
Sioux
1.4%
NO SCHOOLING COMPLETED
100.0/ 100
METRIC RATING
10th/ 347
METRIC RANK
1.8%
NO SCHOOLING COMPLETED
99.0/ 100
METRIC RATING
90th/ 347
METRIC RANK
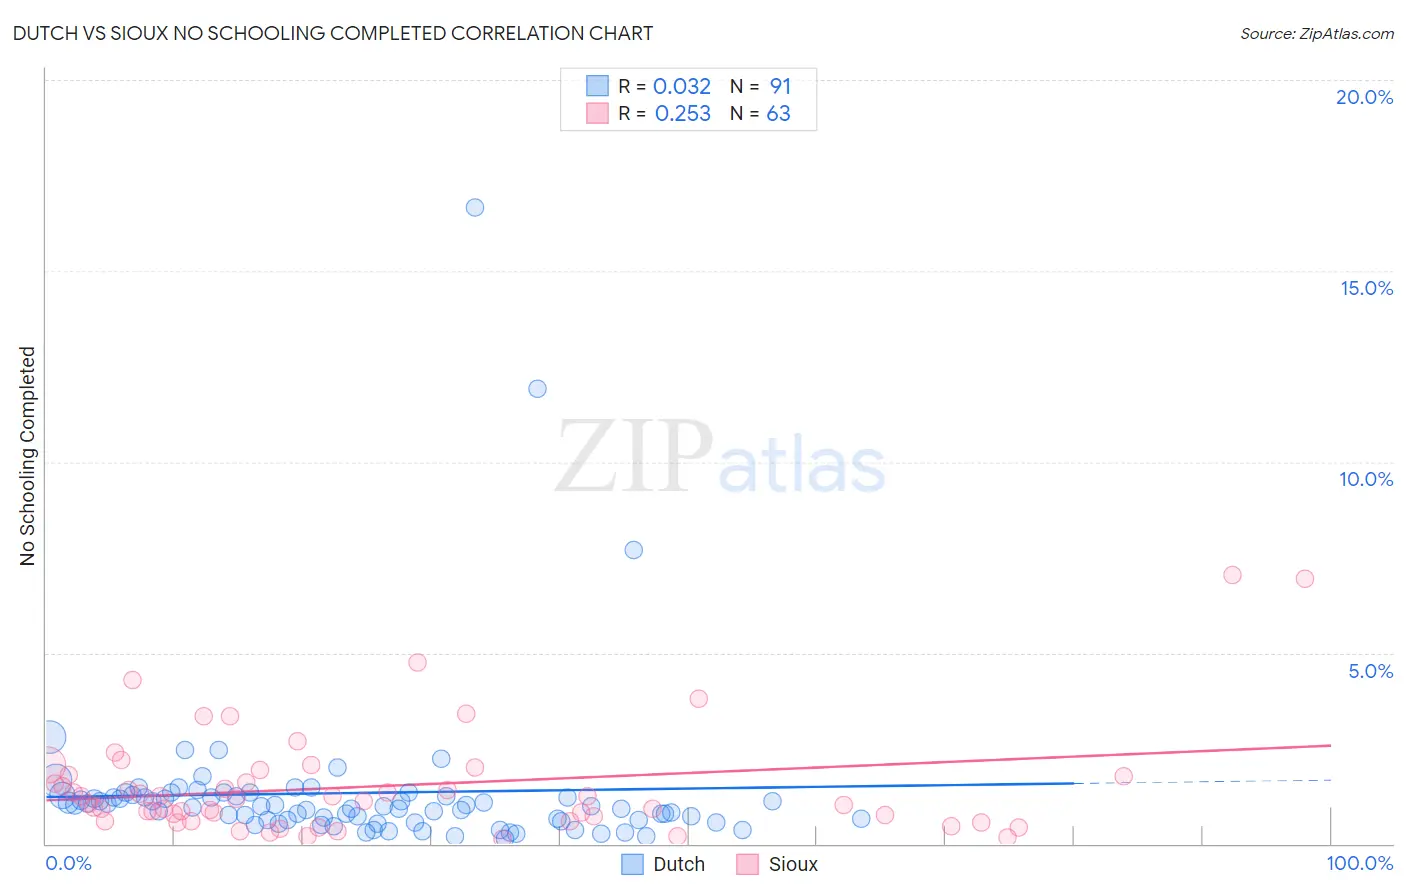
Dutch vs Sioux No Schooling Completed Correlation Chart
The statistical analysis conducted on geographies consisting of 537,646,612 people shows no correlation between the proportion of Dutch and percentage of population with no schooling in the United States with a correlation coefficient (R) of 0.032 and weighted average of 1.4%. Similarly, the statistical analysis conducted on geographies consisting of 231,835,063 people shows a weak positive correlation between the proportion of Sioux and percentage of population with no schooling in the United States with a correlation coefficient (R) of 0.253 and weighted average of 1.8%, a difference of 24.2%.
No Schooling Completed Correlation Summary
| Measurement | Dutch | Sioux |
| Minimum | 0.12% | 0.14% |
| Maximum | 16.7% | 7.0% |
| Range | 16.5% | 6.9% |
| Mean | 1.3% | 1.5% |
| Median | 0.97% | 1.1% |
| Interquartile 25% (IQ1) | 0.62% | 0.60% |
| Interquartile 75% (IQ3) | 1.3% | 1.8% |
| Interquartile Range (IQR) | 0.63% | 1.2% |
| Standard Deviation (Sample) | 2.2% | 1.4% |
| Standard Deviation (Population) | 2.2% | 1.4% |
Similar Demographics by No Schooling Completed
Demographics Similar to Dutch by No Schooling Completed
In terms of no schooling completed, the demographic groups most similar to Dutch are Scottish (1.4%, a difference of 0.80%), Lithuanian (1.4%, a difference of 0.84%), Irish (1.4%, a difference of 0.86%), Polish (1.4%, a difference of 0.89%), and Swedish (1.4%, a difference of 1.3%).
| Demographics | Rating | Rank | No Schooling Completed |
| Norwegians | 100.0 /100 | #3 | Exceptional 1.3% |
| Germans | 100.0 /100 | #4 | Exceptional 1.4% |
| Slovenes | 100.0 /100 | #5 | Exceptional 1.4% |
| Carpatho Rusyns | 100.0 /100 | #6 | Exceptional 1.4% |
| English | 100.0 /100 | #7 | Exceptional 1.4% |
| Swedes | 100.0 /100 | #8 | Exceptional 1.4% |
| Scottish | 100.0 /100 | #9 | Exceptional 1.4% |
| Dutch | 100.0 /100 | #10 | Exceptional 1.4% |
| Lithuanians | 100.0 /100 | #11 | Exceptional 1.4% |
| Irish | 100.0 /100 | #12 | Exceptional 1.4% |
| Poles | 100.0 /100 | #13 | Exceptional 1.4% |
| Scotch-Irish | 100.0 /100 | #14 | Exceptional 1.5% |
| Tlingit-Haida | 100.0 /100 | #15 | Exceptional 1.5% |
| Finns | 100.0 /100 | #16 | Exceptional 1.5% |
| Croatians | 100.0 /100 | #17 | Exceptional 1.5% |
Demographics Similar to Sioux by No Schooling Completed
In terms of no schooling completed, the demographic groups most similar to Sioux are Immigrants from Germany (1.8%, a difference of 0.11%), Romanian (1.8%, a difference of 0.62%), South African (1.8%, a difference of 0.72%), Immigrants from Western Europe (1.8%, a difference of 0.76%), and Osage (1.8%, a difference of 0.79%).
| Demographics | Rating | Rank | No Schooling Completed |
| Potawatomi | 99.3 /100 | #83 | Exceptional 1.7% |
| Immigrants | Denmark | 99.2 /100 | #84 | Exceptional 1.7% |
| Immigrants | Australia | 99.2 /100 | #85 | Exceptional 1.7% |
| Ukrainians | 99.2 /100 | #86 | Exceptional 1.8% |
| Osage | 99.2 /100 | #87 | Exceptional 1.8% |
| Immigrants | Western Europe | 99.2 /100 | #88 | Exceptional 1.8% |
| South Africans | 99.1 /100 | #89 | Exceptional 1.8% |
| Sioux | 99.0 /100 | #90 | Exceptional 1.8% |
| Immigrants | Germany | 99.0 /100 | #91 | Exceptional 1.8% |
| Romanians | 98.8 /100 | #92 | Exceptional 1.8% |
| Turks | 98.7 /100 | #93 | Exceptional 1.8% |
| Immigrants | Nonimmigrants | 98.5 /100 | #94 | Exceptional 1.8% |
| Puget Sound Salish | 98.5 /100 | #95 | Exceptional 1.8% |
| Bhutanese | 98.4 /100 | #96 | Exceptional 1.8% |
| Immigrants | Ireland | 98.4 /100 | #97 | Exceptional 1.8% |