Immigrants from West Indies vs Sioux Median Household Income
COMPARE
Immigrants from West Indies
Sioux
Median Household Income
Median Household Income Comparison
Immigrants from West Indies
Sioux
$77,956
MEDIAN HOUSEHOLD INCOME
1.0/ 100
METRIC RATING
252nd/ 347
METRIC RANK
$67,792
MEDIAN HOUSEHOLD INCOME
0.0/ 100
METRIC RATING
332nd/ 347
METRIC RANK
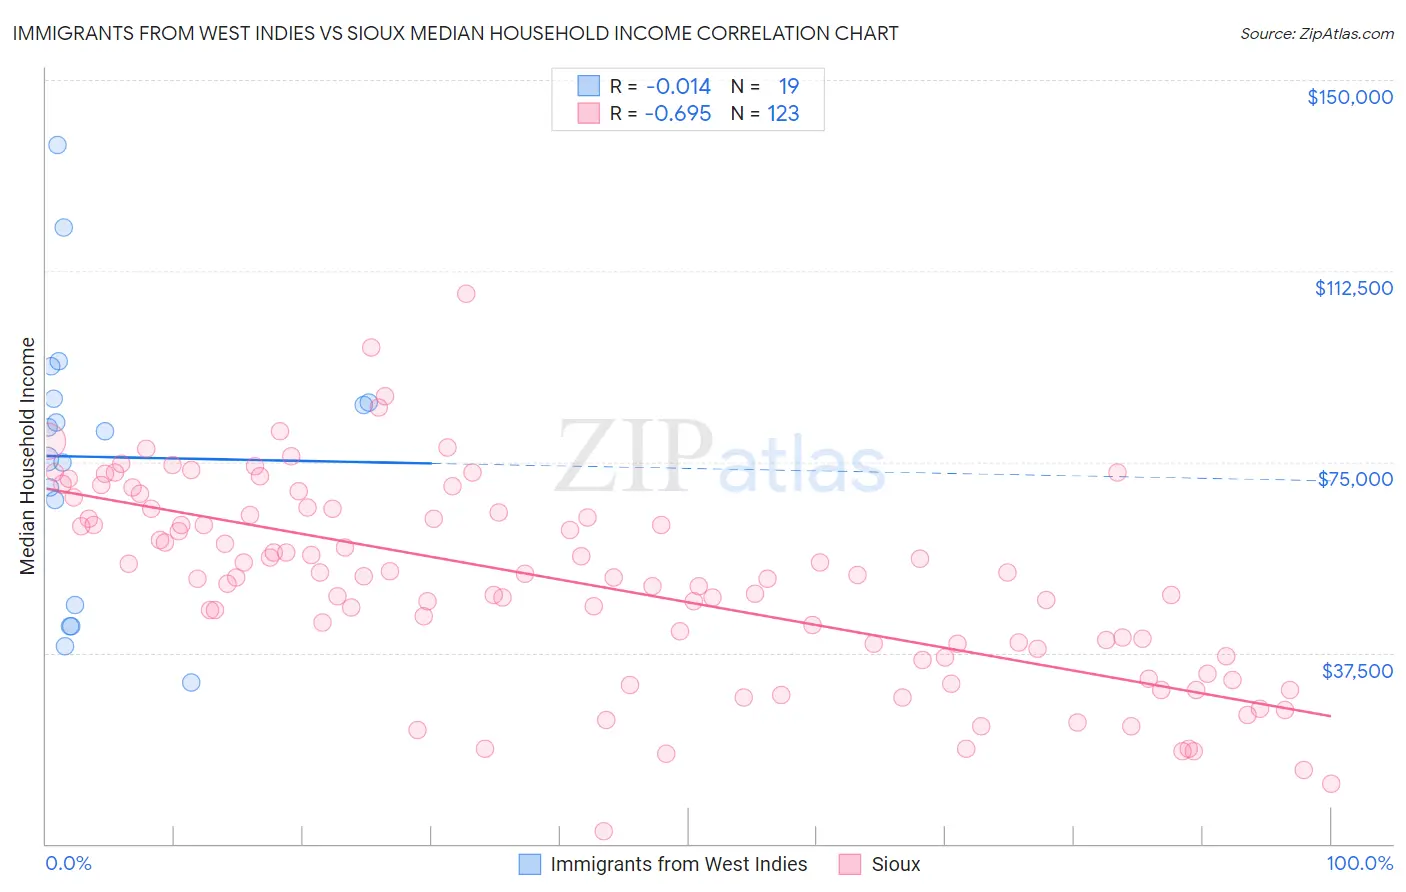
Immigrants from West Indies vs Sioux Median Household Income Correlation Chart
The statistical analysis conducted on geographies consisting of 72,454,628 people shows no correlation between the proportion of Immigrants from West Indies and median household income in the United States with a correlation coefficient (R) of -0.014 and weighted average of $77,956. Similarly, the statistical analysis conducted on geographies consisting of 234,052,794 people shows a significant negative correlation between the proportion of Sioux and median household income in the United States with a correlation coefficient (R) of -0.695 and weighted average of $67,792, a difference of 15.0%.
Median Household Income Correlation Summary
| Measurement | Immigrants from West Indies | Sioux |
| Minimum | $31,731 | $2,499 |
| Maximum | $137,182 | $108,000 |
| Range | $105,451 | $105,501 |
| Mean | $75,944 | $51,141 |
| Median | $81,103 | $52,399 |
| Interquartile 25% (IQ1) | $46,875 | $36,923 |
| Interquartile 75% (IQ3) | $87,404 | $65,000 |
| Interquartile Range (IQR) | $40,529 | $28,077 |
| Standard Deviation (Sample) | $27,297 | $19,497 |
| Standard Deviation (Population) | $26,569 | $19,417 |
Similar Demographics by Median Household Income
Demographics Similar to Immigrants from West Indies by Median Household Income
In terms of median household income, the demographic groups most similar to Immigrants from West Indies are Mexican American Indian ($78,166, a difference of 0.27%), Immigrants from St. Vincent and the Grenadines ($77,690, a difference of 0.34%), Subsaharan African ($77,631, a difference of 0.42%), Immigrants from Laos ($78,327, a difference of 0.48%), and Immigrants from Middle Africa ($77,559, a difference of 0.51%).
| Demographics | Rating | Rank | Median Household Income |
| Inupiat | 1.8 /100 | #245 | Tragic $78,841 |
| Central Americans | 1.7 /100 | #246 | Tragic $78,803 |
| Immigrants | Burma/Myanmar | 1.6 /100 | #247 | Tragic $78,682 |
| Sudanese | 1.5 /100 | #248 | Tragic $78,529 |
| West Indians | 1.4 /100 | #249 | Tragic $78,455 |
| Immigrants | Laos | 1.3 /100 | #250 | Tragic $78,327 |
| Mexican American Indians | 1.2 /100 | #251 | Tragic $78,166 |
| Immigrants | West Indies | 1.0 /100 | #252 | Tragic $77,956 |
| Immigrants | St. Vincent and the Grenadines | 0.9 /100 | #253 | Tragic $77,690 |
| Sub-Saharan Africans | 0.8 /100 | #254 | Tragic $77,631 |
| Immigrants | Middle Africa | 0.8 /100 | #255 | Tragic $77,559 |
| Belizeans | 0.6 /100 | #256 | Tragic $77,028 |
| Immigrants | Senegal | 0.5 /100 | #257 | Tragic $76,915 |
| Immigrants | Nicaragua | 0.5 /100 | #258 | Tragic $76,784 |
| Spanish American Indians | 0.4 /100 | #259 | Tragic $76,670 |
Demographics Similar to Sioux by Median Household Income
In terms of median household income, the demographic groups most similar to Sioux are Creek ($67,715, a difference of 0.11%), Native/Alaskan ($67,879, a difference of 0.13%), Arapaho ($67,965, a difference of 0.25%), Black/African American ($67,573, a difference of 0.32%), and Dutch West Indian ($68,412, a difference of 0.91%).
| Demographics | Rating | Rank | Median Household Income |
| Seminole | 0.0 /100 | #325 | Tragic $69,420 |
| Yuman | 0.0 /100 | #326 | Tragic $68,743 |
| Immigrants | Cuba | 0.0 /100 | #327 | Tragic $68,461 |
| Menominee | 0.0 /100 | #328 | Tragic $68,423 |
| Dutch West Indians | 0.0 /100 | #329 | Tragic $68,412 |
| Arapaho | 0.0 /100 | #330 | Tragic $67,965 |
| Natives/Alaskans | 0.0 /100 | #331 | Tragic $67,879 |
| Sioux | 0.0 /100 | #332 | Tragic $67,792 |
| Creek | 0.0 /100 | #333 | Tragic $67,715 |
| Blacks/African Americans | 0.0 /100 | #334 | Tragic $67,573 |
| Cheyenne | 0.0 /100 | #335 | Tragic $66,974 |
| Immigrants | Congo | 0.0 /100 | #336 | Tragic $66,768 |
| Kiowa | 0.0 /100 | #337 | Tragic $65,914 |
| Immigrants | Yemen | 0.0 /100 | #338 | Tragic $65,194 |
| Hopi | 0.0 /100 | #339 | Tragic $65,043 |