Immigrants from Armenia vs Sioux Median Household Income
COMPARE
Immigrants from Armenia
Sioux
Median Household Income
Median Household Income Comparison
Immigrants from Armenia
Sioux
$83,555
MEDIAN HOUSEHOLD INCOME
27.0/ 100
METRIC RATING
195th/ 347
METRIC RANK
$67,792
MEDIAN HOUSEHOLD INCOME
0.0/ 100
METRIC RATING
332nd/ 347
METRIC RANK
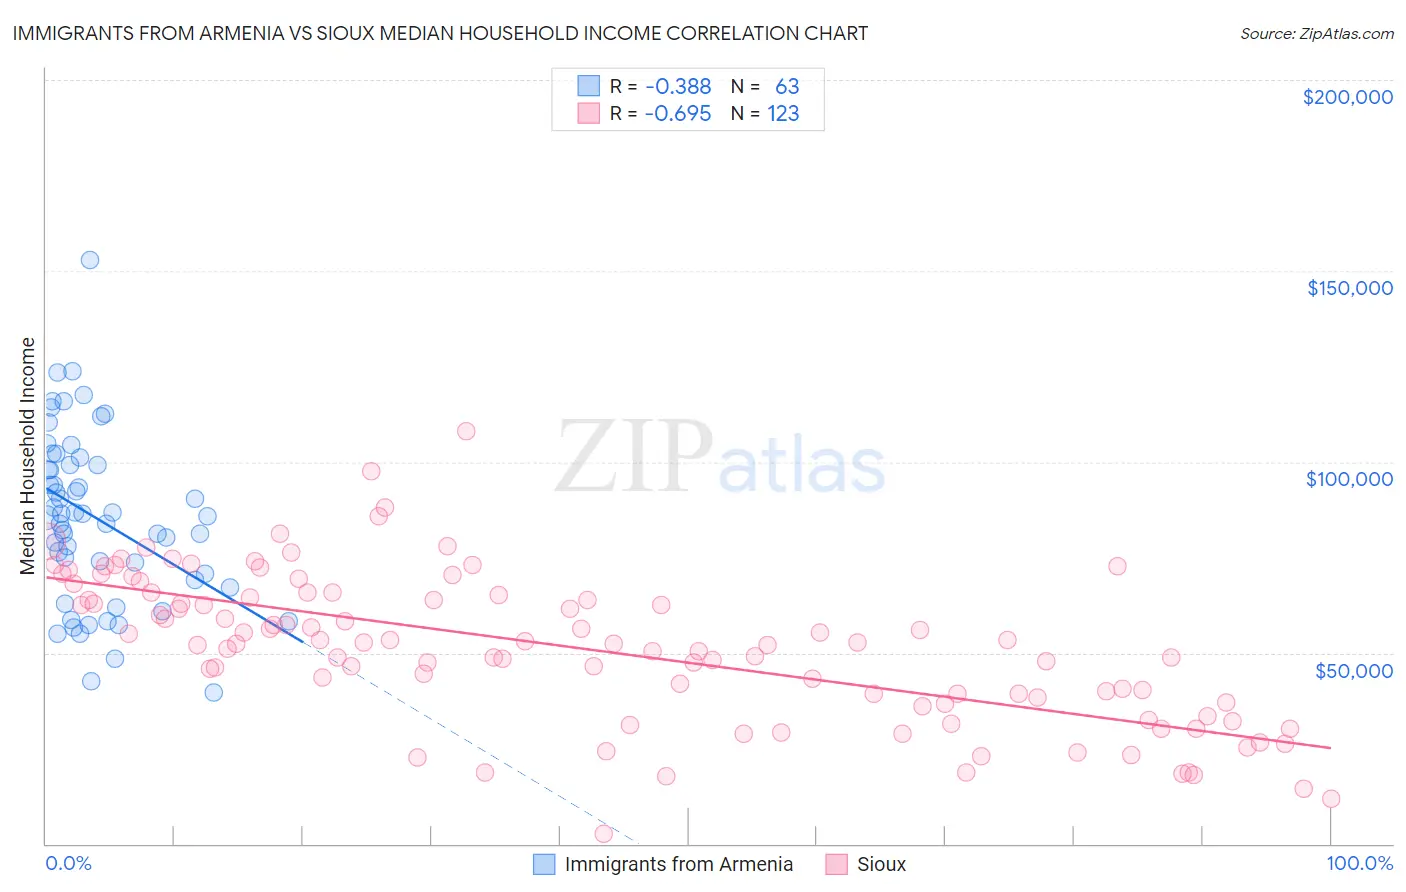
Immigrants from Armenia vs Sioux Median Household Income Correlation Chart
The statistical analysis conducted on geographies consisting of 97,712,518 people shows a mild negative correlation between the proportion of Immigrants from Armenia and median household income in the United States with a correlation coefficient (R) of -0.388 and weighted average of $83,555. Similarly, the statistical analysis conducted on geographies consisting of 234,052,794 people shows a significant negative correlation between the proportion of Sioux and median household income in the United States with a correlation coefficient (R) of -0.695 and weighted average of $67,792, a difference of 23.3%.
Median Household Income Correlation Summary
| Measurement | Immigrants from Armenia | Sioux |
| Minimum | $39,713 | $2,499 |
| Maximum | $152,803 | $108,000 |
| Range | $113,090 | $105,501 |
| Mean | $85,202 | $51,141 |
| Median | $85,651 | $52,399 |
| Interquartile 25% (IQ1) | $69,102 | $36,923 |
| Interquartile 75% (IQ3) | $99,318 | $65,000 |
| Interquartile Range (IQR) | $30,216 | $28,077 |
| Standard Deviation (Sample) | $22,242 | $19,497 |
| Standard Deviation (Population) | $22,064 | $19,417 |
Similar Demographics by Median Household Income
Demographics Similar to Immigrants from Armenia by Median Household Income
In terms of median household income, the demographic groups most similar to Immigrants from Armenia are Ghanaian ($83,582, a difference of 0.030%), Finnish ($83,607, a difference of 0.060%), Welsh ($83,628, a difference of 0.090%), French ($83,468, a difference of 0.10%), and Aleut ($83,446, a difference of 0.13%).
| Demographics | Rating | Rank | Median Household Income |
| Tlingit-Haida | 32.6 /100 | #188 | Fair $83,968 |
| Immigrants | Colombia | 31.7 /100 | #189 | Fair $83,902 |
| Slovaks | 30.2 /100 | #190 | Fair $83,798 |
| Iraqis | 29.6 /100 | #191 | Fair $83,753 |
| Welsh | 28.0 /100 | #192 | Fair $83,628 |
| Finns | 27.7 /100 | #193 | Fair $83,607 |
| Ghanaians | 27.4 /100 | #194 | Fair $83,582 |
| Immigrants | Armenia | 27.0 /100 | #195 | Fair $83,555 |
| French | 26.0 /100 | #196 | Fair $83,468 |
| Aleuts | 25.7 /100 | #197 | Fair $83,446 |
| Japanese | 25.1 /100 | #198 | Fair $83,395 |
| Germans | 24.6 /100 | #199 | Fair $83,358 |
| Tsimshian | 24.5 /100 | #200 | Fair $83,346 |
| Spanish | 24.4 /100 | #201 | Fair $83,343 |
| Immigrants | Thailand | 24.3 /100 | #202 | Fair $83,327 |
Demographics Similar to Sioux by Median Household Income
In terms of median household income, the demographic groups most similar to Sioux are Creek ($67,715, a difference of 0.11%), Native/Alaskan ($67,879, a difference of 0.13%), Arapaho ($67,965, a difference of 0.25%), Black/African American ($67,573, a difference of 0.32%), and Dutch West Indian ($68,412, a difference of 0.91%).
| Demographics | Rating | Rank | Median Household Income |
| Seminole | 0.0 /100 | #325 | Tragic $69,420 |
| Yuman | 0.0 /100 | #326 | Tragic $68,743 |
| Immigrants | Cuba | 0.0 /100 | #327 | Tragic $68,461 |
| Menominee | 0.0 /100 | #328 | Tragic $68,423 |
| Dutch West Indians | 0.0 /100 | #329 | Tragic $68,412 |
| Arapaho | 0.0 /100 | #330 | Tragic $67,965 |
| Natives/Alaskans | 0.0 /100 | #331 | Tragic $67,879 |
| Sioux | 0.0 /100 | #332 | Tragic $67,792 |
| Creek | 0.0 /100 | #333 | Tragic $67,715 |
| Blacks/African Americans | 0.0 /100 | #334 | Tragic $67,573 |
| Cheyenne | 0.0 /100 | #335 | Tragic $66,974 |
| Immigrants | Congo | 0.0 /100 | #336 | Tragic $66,768 |
| Kiowa | 0.0 /100 | #337 | Tragic $65,914 |
| Immigrants | Yemen | 0.0 /100 | #338 | Tragic $65,194 |
| Hopi | 0.0 /100 | #339 | Tragic $65,043 |