Dutch vs Polish Median Household Income
COMPARE
Dutch
Polish
Median Household Income
Median Household Income Comparison
Dutch
Poles
$82,971
MEDIAN HOUSEHOLD INCOME
20.3/ 100
METRIC RATING
207th/ 347
METRIC RANK
$88,472
MEDIAN HOUSEHOLD INCOME
89.7/ 100
METRIC RATING
136th/ 347
METRIC RANK
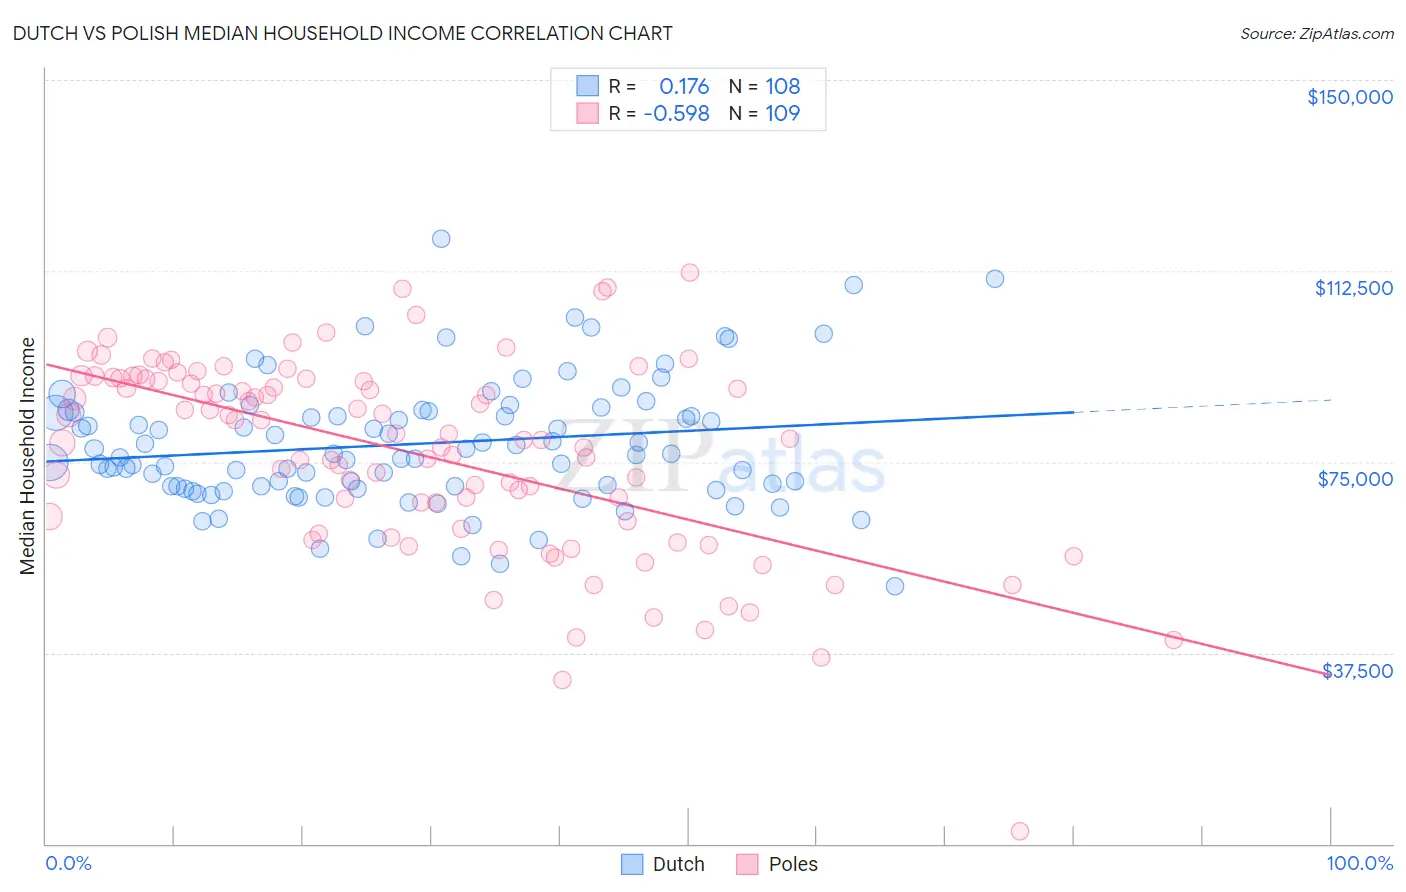
Dutch vs Polish Median Household Income Correlation Chart
The statistical analysis conducted on geographies consisting of 553,516,868 people shows a poor positive correlation between the proportion of Dutch and median household income in the United States with a correlation coefficient (R) of 0.176 and weighted average of $82,971. Similarly, the statistical analysis conducted on geographies consisting of 559,571,407 people shows a substantial negative correlation between the proportion of Poles and median household income in the United States with a correlation coefficient (R) of -0.598 and weighted average of $88,472, a difference of 6.6%.
Median Household Income Correlation Summary
| Measurement | Dutch | Polish |
| Minimum | $50,679 | $2,499 |
| Maximum | $118,750 | $112,083 |
| Range | $68,071 | $109,584 |
| Mean | $78,501 | $76,577 |
| Median | $76,487 | $79,444 |
| Interquartile 25% (IQ1) | $70,197 | $62,696 |
| Interquartile 75% (IQ3) | $84,813 | $91,347 |
| Interquartile Range (IQR) | $14,616 | $28,651 |
| Standard Deviation (Sample) | $12,272 | $19,210 |
| Standard Deviation (Population) | $12,215 | $19,121 |
Similar Demographics by Median Household Income
Demographics Similar to Dutch by Median Household Income
In terms of median household income, the demographic groups most similar to Dutch are Immigrants from Kenya ($83,068, a difference of 0.12%), French Canadian ($82,810, a difference of 0.19%), Celtic ($83,193, a difference of 0.27%), Immigrants from Africa ($83,289, a difference of 0.38%), and Immigrants from Cambodia ($83,304, a difference of 0.40%).
| Demographics | Rating | Rank | Median Household Income |
| Tsimshian | 24.5 /100 | #200 | Fair $83,346 |
| Spanish | 24.4 /100 | #201 | Fair $83,343 |
| Immigrants | Thailand | 24.3 /100 | #202 | Fair $83,327 |
| Immigrants | Cambodia | 24.0 /100 | #203 | Fair $83,304 |
| Immigrants | Africa | 23.8 /100 | #204 | Fair $83,289 |
| Celtics | 22.7 /100 | #205 | Fair $83,193 |
| Immigrants | Kenya | 21.3 /100 | #206 | Fair $83,068 |
| Dutch | 20.3 /100 | #207 | Fair $82,971 |
| French Canadians | 18.7 /100 | #208 | Poor $82,810 |
| Immigrants | Iraq | 16.7 /100 | #209 | Poor $82,594 |
| Immigrants | Uruguay | 16.4 /100 | #210 | Poor $82,560 |
| Salvadorans | 15.4 /100 | #211 | Poor $82,449 |
| Venezuelans | 15.3 /100 | #212 | Poor $82,432 |
| Nepalese | 15.1 /100 | #213 | Poor $82,410 |
| Panamanians | 14.0 /100 | #214 | Poor $82,272 |
Demographics Similar to Poles by Median Household Income
In terms of median household income, the demographic groups most similar to Poles are Sierra Leonean ($88,463, a difference of 0.010%), Immigrants from Sierra Leone ($88,498, a difference of 0.030%), Swedish ($88,524, a difference of 0.060%), Arab ($88,398, a difference of 0.080%), and Immigrants from Chile ($88,388, a difference of 0.090%).
| Demographics | Rating | Rank | Median Household Income |
| Brazilians | 92.1 /100 | #129 | Exceptional $88,934 |
| British | 92.0 /100 | #130 | Exceptional $88,914 |
| Immigrants | Syria | 91.4 /100 | #131 | Exceptional $88,792 |
| Europeans | 91.2 /100 | #132 | Exceptional $88,751 |
| Immigrants | Ethiopia | 90.9 /100 | #133 | Exceptional $88,687 |
| Swedes | 90.0 /100 | #134 | Exceptional $88,524 |
| Immigrants | Sierra Leone | 89.9 /100 | #135 | Excellent $88,498 |
| Poles | 89.7 /100 | #136 | Excellent $88,472 |
| Sierra Leoneans | 89.6 /100 | #137 | Excellent $88,463 |
| Arabs | 89.2 /100 | #138 | Excellent $88,398 |
| Immigrants | Chile | 89.2 /100 | #139 | Excellent $88,388 |
| Lebanese | 87.2 /100 | #140 | Excellent $88,091 |
| Immigrants | Morocco | 86.0 /100 | #141 | Excellent $87,930 |
| Canadians | 84.7 /100 | #142 | Excellent $87,769 |
| Danes | 83.9 /100 | #143 | Excellent $87,676 |