Immigrants from Guatemala vs South African Per Capita Income
COMPARE
Immigrants from Guatemala
South African
Per Capita Income
Per Capita Income Comparison
Immigrants from Guatemala
South Africans
$37,550
PER CAPITA INCOME
0.1/ 100
METRIC RATING
290th/ 347
METRIC RANK
$50,044
PER CAPITA INCOME
99.9/ 100
METRIC RATING
57th/ 347
METRIC RANK
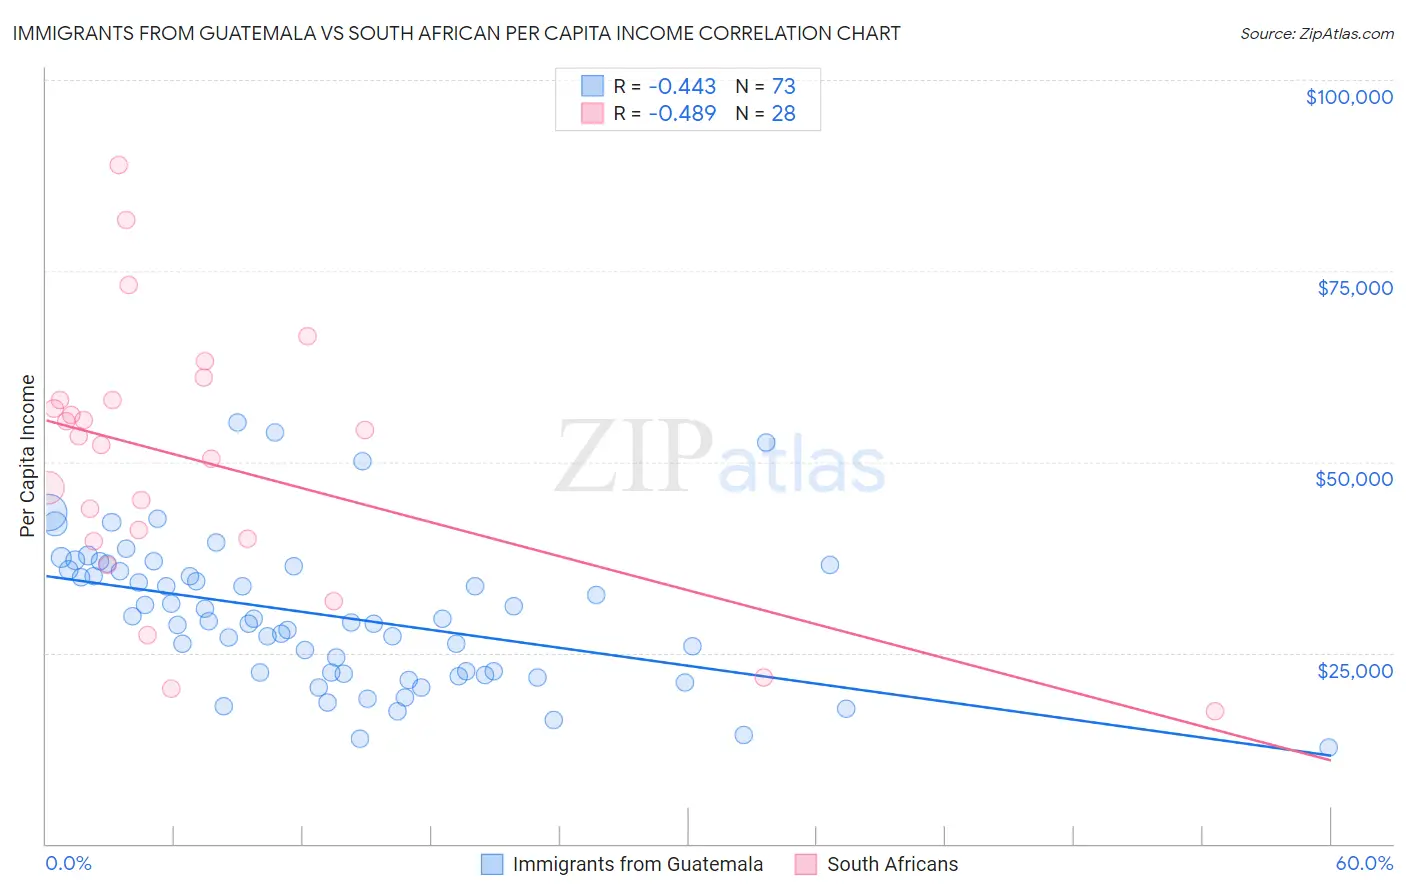
Immigrants from Guatemala vs South African Per Capita Income Correlation Chart
The statistical analysis conducted on geographies consisting of 377,292,357 people shows a moderate negative correlation between the proportion of Immigrants from Guatemala and per capita income in the United States with a correlation coefficient (R) of -0.443 and weighted average of $37,550. Similarly, the statistical analysis conducted on geographies consisting of 182,604,546 people shows a moderate negative correlation between the proportion of South Africans and per capita income in the United States with a correlation coefficient (R) of -0.489 and weighted average of $50,044, a difference of 33.3%.
Per Capita Income Correlation Summary
| Measurement | Immigrants from Guatemala | South African |
| Minimum | $12,606 | $17,364 |
| Maximum | $55,157 | $88,818 |
| Range | $42,551 | $71,454 |
| Mean | $29,919 | $49,855 |
| Median | $29,061 | $52,728 |
| Interquartile 25% (IQ1) | $22,369 | $39,824 |
| Interquartile 75% (IQ3) | $36,058 | $58,137 |
| Interquartile Range (IQR) | $13,690 | $18,313 |
| Standard Deviation (Sample) | $9,360 | $17,281 |
| Standard Deviation (Population) | $9,296 | $16,970 |
Similar Demographics by Per Capita Income
Demographics Similar to Immigrants from Guatemala by Per Capita Income
In terms of per capita income, the demographic groups most similar to Immigrants from Guatemala are Cajun ($37,527, a difference of 0.060%), U.S. Virgin Islander ($37,589, a difference of 0.10%), Immigrants from Micronesia ($37,464, a difference of 0.23%), Mexican American Indian ($37,407, a difference of 0.38%), and Dominican ($37,697, a difference of 0.39%).
| Demographics | Rating | Rank | Per Capita Income |
| Pennsylvania Germans | 0.1 /100 | #283 | Tragic $37,842 |
| Africans | 0.1 /100 | #284 | Tragic $37,785 |
| Guatemalans | 0.1 /100 | #285 | Tragic $37,766 |
| Central American Indians | 0.1 /100 | #286 | Tragic $37,699 |
| Dominicans | 0.1 /100 | #287 | Tragic $37,697 |
| Blackfeet | 0.1 /100 | #288 | Tragic $37,695 |
| U.S. Virgin Islanders | 0.1 /100 | #289 | Tragic $37,589 |
| Immigrants | Guatemala | 0.1 /100 | #290 | Tragic $37,550 |
| Cajuns | 0.1 /100 | #291 | Tragic $37,527 |
| Immigrants | Micronesia | 0.1 /100 | #292 | Tragic $37,464 |
| Mexican American Indians | 0.1 /100 | #293 | Tragic $37,407 |
| Cubans | 0.1 /100 | #294 | Tragic $37,383 |
| Immigrants | Dominican Republic | 0.1 /100 | #295 | Tragic $37,306 |
| Indonesians | 0.1 /100 | #296 | Tragic $37,300 |
| Haitians | 0.1 /100 | #297 | Tragic $37,289 |
Demographics Similar to South Africans by Per Capita Income
In terms of per capita income, the demographic groups most similar to South Africans are Asian ($50,057, a difference of 0.030%), Immigrants from Western Europe ($50,065, a difference of 0.040%), Immigrants from Malaysia ($49,983, a difference of 0.12%), Bhutanese ($49,894, a difference of 0.30%), and Immigrants from Scotland ($49,893, a difference of 0.30%).
| Demographics | Rating | Rank | Per Capita Income |
| Immigrants | Sri Lanka | 100.0 /100 | #50 | Exceptional $50,555 |
| Immigrants | Netherlands | 100.0 /100 | #51 | Exceptional $50,458 |
| Immigrants | Croatia | 99.9 /100 | #52 | Exceptional $50,417 |
| Paraguayans | 99.9 /100 | #53 | Exceptional $50,385 |
| Immigrants | Belarus | 99.9 /100 | #54 | Exceptional $50,303 |
| Immigrants | Western Europe | 99.9 /100 | #55 | Exceptional $50,065 |
| Asians | 99.9 /100 | #56 | Exceptional $50,057 |
| South Africans | 99.9 /100 | #57 | Exceptional $50,044 |
| Immigrants | Malaysia | 99.9 /100 | #58 | Exceptional $49,983 |
| Bhutanese | 99.9 /100 | #59 | Exceptional $49,894 |
| Immigrants | Scotland | 99.9 /100 | #60 | Exceptional $49,893 |
| Argentineans | 99.9 /100 | #61 | Exceptional $49,862 |
| Immigrants | Asia | 99.9 /100 | #62 | Exceptional $49,741 |
| Maltese | 99.9 /100 | #63 | Exceptional $49,640 |
| Immigrants | Argentina | 99.9 /100 | #64 | Exceptional $49,627 |