Delaware vs Trinidadian and Tobagonian Median Earnings
COMPARE
Delaware
Trinidadian and Tobagonian
Median Earnings
Median Earnings Comparison
Delaware
Trinidadians and Tobagonians
$44,783
MEDIAN EARNINGS
9.0/ 100
METRIC RATING
232nd/ 347
METRIC RANK
$45,820
MEDIAN EARNINGS
29.7/ 100
METRIC RATING
198th/ 347
METRIC RANK
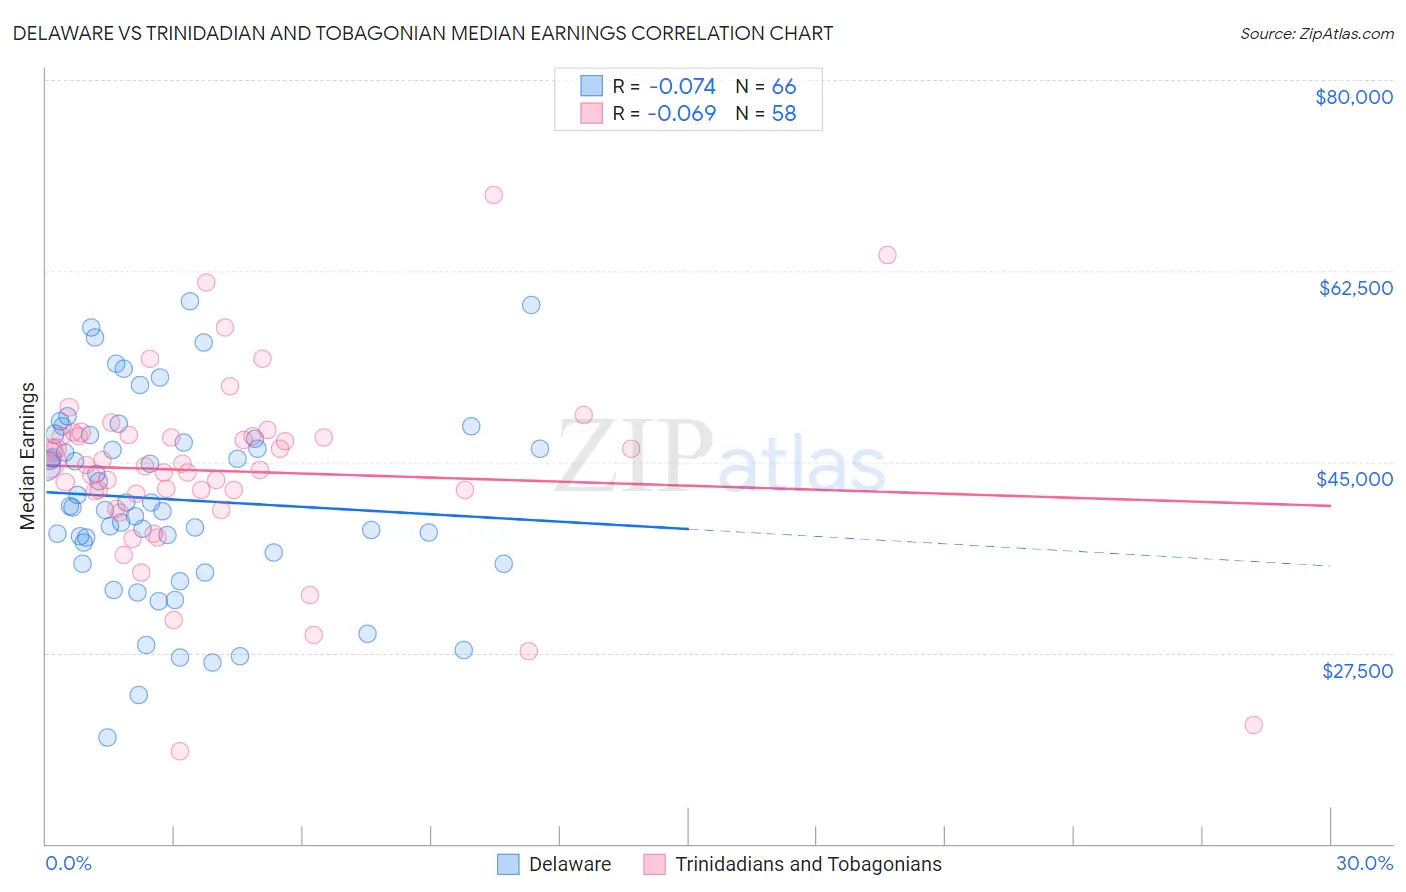
Delaware vs Trinidadian and Tobagonian Median Earnings Correlation Chart
The statistical analysis conducted on geographies consisting of 96,235,383 people shows a slight negative correlation between the proportion of Delaware and median earnings in the United States with a correlation coefficient (R) of -0.074 and weighted average of $44,783. Similarly, the statistical analysis conducted on geographies consisting of 219,864,725 people shows a slight negative correlation between the proportion of Trinidadians and Tobagonians and median earnings in the United States with a correlation coefficient (R) of -0.069 and weighted average of $45,820, a difference of 2.3%.
Median Earnings Correlation Summary
| Measurement | Delaware | Trinidadian and Tobagonian |
| Minimum | $19,766 | $18,432 |
| Maximum | $59,711 | $69,500 |
| Range | $39,945 | $51,068 |
| Mean | $41,572 | $44,150 |
| Median | $41,074 | $44,668 |
| Interquartile 25% (IQ1) | $36,711 | $42,022 |
| Interquartile 75% (IQ3) | $47,149 | $47,373 |
| Interquartile Range (IQR) | $10,438 | $5,351 |
| Standard Deviation (Sample) | $8,740 | $8,720 |
| Standard Deviation (Population) | $8,674 | $8,644 |
Similar Demographics by Median Earnings
Demographics Similar to Delaware by Median Earnings
In terms of median earnings, the demographic groups most similar to Delaware are Immigrants from Sudan ($44,767, a difference of 0.040%), Japanese ($44,825, a difference of 0.090%), Immigrants from Western Africa ($44,893, a difference of 0.24%), Scotch-Irish ($44,924, a difference of 0.32%), and Cape Verdean ($44,640, a difference of 0.32%).
| Demographics | Rating | Rank | Median Earnings |
| Immigrants | Cambodia | 13.2 /100 | #225 | Poor $45,090 |
| Immigrants | Nigeria | 12.2 /100 | #226 | Poor $45,030 |
| Native Hawaiians | 12.2 /100 | #227 | Poor $45,027 |
| Immigrants | Iraq | 11.6 /100 | #228 | Poor $44,988 |
| Scotch-Irish | 10.7 /100 | #229 | Poor $44,924 |
| Immigrants | Western Africa | 10.3 /100 | #230 | Poor $44,893 |
| Japanese | 9.5 /100 | #231 | Tragic $44,825 |
| Delaware | 9.0 /100 | #232 | Tragic $44,783 |
| Immigrants | Sudan | 8.8 /100 | #233 | Tragic $44,767 |
| Cape Verdeans | 7.5 /100 | #234 | Tragic $44,640 |
| Venezuelans | 6.9 /100 | #235 | Tragic $44,580 |
| British West Indians | 6.7 /100 | #236 | Tragic $44,552 |
| Immigrants | Ecuador | 5.9 /100 | #237 | Tragic $44,462 |
| Sudanese | 5.6 /100 | #238 | Tragic $44,419 |
| Senegalese | 5.3 /100 | #239 | Tragic $44,373 |
Demographics Similar to Trinidadians and Tobagonians by Median Earnings
In terms of median earnings, the demographic groups most similar to Trinidadians and Tobagonians are Immigrants from Barbados ($45,816, a difference of 0.010%), Immigrants from the Azores ($45,812, a difference of 0.020%), Yugoslavian ($45,846, a difference of 0.060%), Barbadian ($45,846, a difference of 0.060%), and Immigrants from St. Vincent and the Grenadines ($45,908, a difference of 0.19%).
| Demographics | Rating | Rank | Median Earnings |
| Finns | 33.4 /100 | #191 | Fair $45,940 |
| Germans | 33.2 /100 | #192 | Fair $45,935 |
| Guamanians/Chamorros | 33.2 /100 | #193 | Fair $45,933 |
| Immigrants | Costa Rica | 33.0 /100 | #194 | Fair $45,928 |
| Immigrants | St. Vincent and the Grenadines | 32.4 /100 | #195 | Fair $45,908 |
| Yugoslavians | 30.5 /100 | #196 | Fair $45,846 |
| Barbadians | 30.5 /100 | #197 | Fair $45,846 |
| Trinidadians and Tobagonians | 29.7 /100 | #198 | Fair $45,820 |
| Immigrants | Barbados | 29.6 /100 | #199 | Fair $45,816 |
| Immigrants | Azores | 29.5 /100 | #200 | Fair $45,812 |
| Celtics | 27.2 /100 | #201 | Fair $45,732 |
| Immigrants | Trinidad and Tobago | 27.1 /100 | #202 | Fair $45,729 |
| Welsh | 26.6 /100 | #203 | Fair $45,710 |
| Immigrants | Uruguay | 25.9 /100 | #204 | Fair $45,682 |
| Tongans | 25.4 /100 | #205 | Fair $45,665 |