Delaware vs Hawaiian Median Earnings
COMPARE
Delaware
Hawaiian
Median Earnings
Median Earnings Comparison
Delaware
Hawaiians
$44,783
MEDIAN EARNINGS
9.0/ 100
METRIC RATING
232nd/ 347
METRIC RANK
$43,673
MEDIAN EARNINGS
2.0/ 100
METRIC RATING
252nd/ 347
METRIC RANK
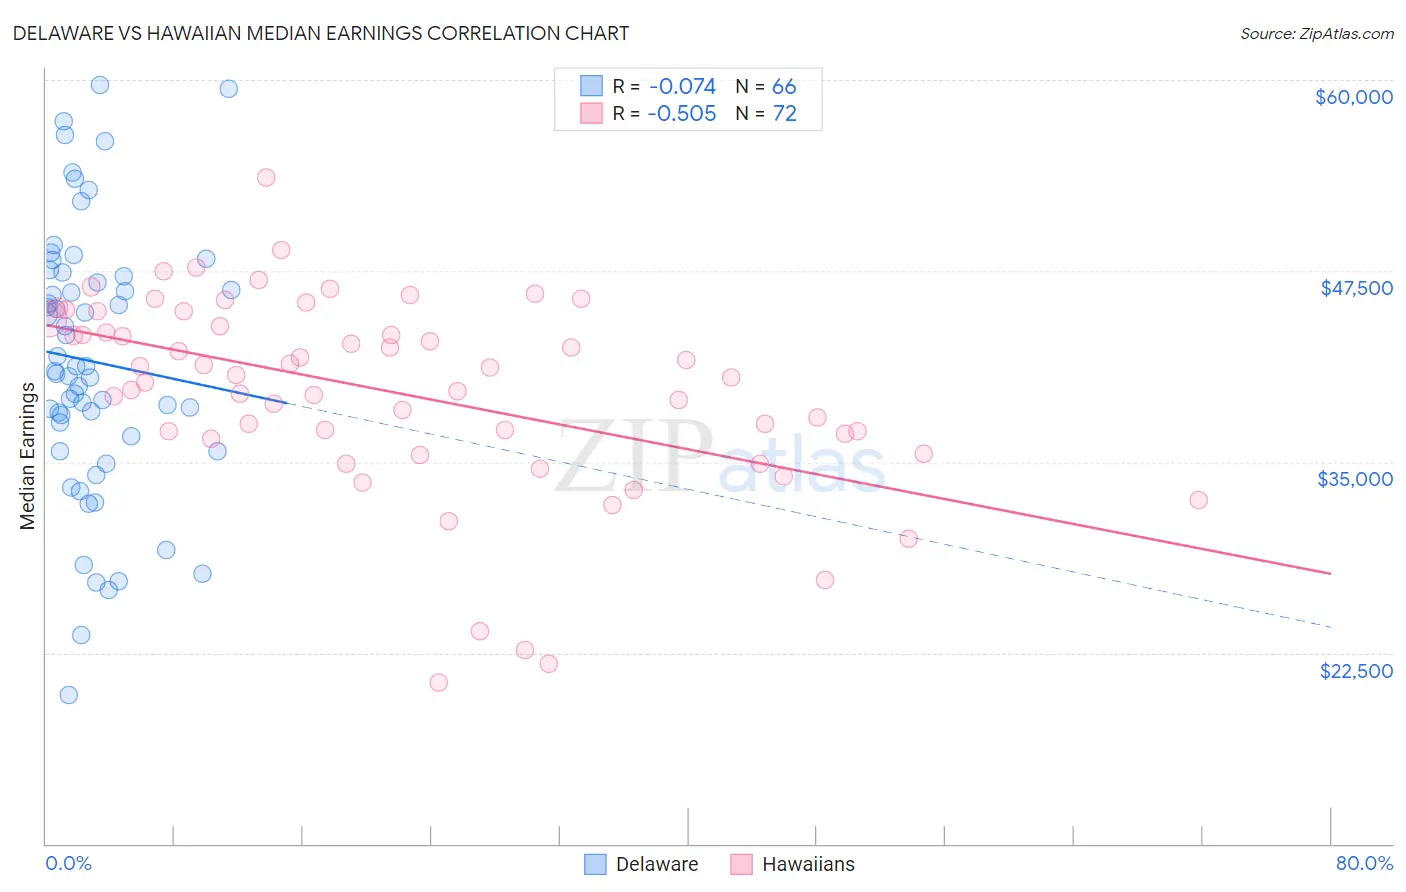
Delaware vs Hawaiian Median Earnings Correlation Chart
The statistical analysis conducted on geographies consisting of 96,235,383 people shows a slight negative correlation between the proportion of Delaware and median earnings in the United States with a correlation coefficient (R) of -0.074 and weighted average of $44,783. Similarly, the statistical analysis conducted on geographies consisting of 327,597,222 people shows a substantial negative correlation between the proportion of Hawaiians and median earnings in the United States with a correlation coefficient (R) of -0.505 and weighted average of $43,673, a difference of 2.5%.
Median Earnings Correlation Summary
| Measurement | Delaware | Hawaiian |
| Minimum | $19,766 | $20,530 |
| Maximum | $59,711 | $53,613 |
| Range | $39,945 | $33,083 |
| Mean | $41,572 | $39,525 |
| Median | $41,074 | $40,637 |
| Interquartile 25% (IQ1) | $36,711 | $36,694 |
| Interquartile 75% (IQ3) | $47,149 | $44,126 |
| Interquartile Range (IQR) | $10,438 | $7,432 |
| Standard Deviation (Sample) | $8,740 | $6,473 |
| Standard Deviation (Population) | $8,674 | $6,428 |
Demographics Similar to Delaware and Hawaiians by Median Earnings
In terms of median earnings, the demographic groups most similar to Delaware are Immigrants from Sudan ($44,767, a difference of 0.040%), Cape Verdean ($44,640, a difference of 0.32%), Venezuelan ($44,580, a difference of 0.46%), British West Indian ($44,552, a difference of 0.52%), and Immigrants from Ecuador ($44,462, a difference of 0.72%). Similarly, the demographic groups most similar to Hawaiians are Tsimshian ($43,695, a difference of 0.050%), Alaska Native ($43,750, a difference of 0.18%), Malaysian ($43,844, a difference of 0.39%), Nepalese ($43,860, a difference of 0.43%), and Immigrants from Cabo Verde ($43,963, a difference of 0.66%).
| Demographics | Rating | Rank | Median Earnings |
| Delaware | 9.0 /100 | #232 | Tragic $44,783 |
| Immigrants | Sudan | 8.8 /100 | #233 | Tragic $44,767 |
| Cape Verdeans | 7.5 /100 | #234 | Tragic $44,640 |
| Venezuelans | 6.9 /100 | #235 | Tragic $44,580 |
| British West Indians | 6.7 /100 | #236 | Tragic $44,552 |
| Immigrants | Ecuador | 5.9 /100 | #237 | Tragic $44,462 |
| Sudanese | 5.6 /100 | #238 | Tragic $44,419 |
| Senegalese | 5.3 /100 | #239 | Tragic $44,373 |
| Aleuts | 4.4 /100 | #240 | Tragic $44,241 |
| Samoans | 4.2 /100 | #241 | Tragic $44,206 |
| Immigrants | Venezuela | 4.0 /100 | #242 | Tragic $44,163 |
| Sub-Saharan Africans | 3.7 /100 | #243 | Tragic $44,118 |
| Immigrants | Nonimmigrants | 3.7 /100 | #244 | Tragic $44,117 |
| Immigrants | Burma/Myanmar | 3.2 /100 | #245 | Tragic $43,998 |
| Immigrants | West Indies | 3.1 /100 | #246 | Tragic $43,989 |
| Immigrants | Cabo Verde | 3.0 /100 | #247 | Tragic $43,963 |
| Nepalese | 2.6 /100 | #248 | Tragic $43,860 |
| Malaysians | 2.6 /100 | #249 | Tragic $43,844 |
| Alaska Natives | 2.3 /100 | #250 | Tragic $43,750 |
| Tsimshian | 2.1 /100 | #251 | Tragic $43,695 |
| Hawaiians | 2.0 /100 | #252 | Tragic $43,673 |