Cypriot vs Somali Householder Income Ages 45 - 64 years
COMPARE
Cypriot
Somali
Householder Income Ages 45 - 64 years
Householder Income Ages 45 - 64 years Comparison
Cypriots
Somalis
$123,396
HOUSEHOLDER INCOME AGES 45 - 64 YEARS
100.0/ 100
METRIC RATING
11th/ 347
METRIC RANK
$88,600
HOUSEHOLDER INCOME AGES 45 - 64 YEARS
0.3/ 100
METRIC RATING
262nd/ 347
METRIC RANK
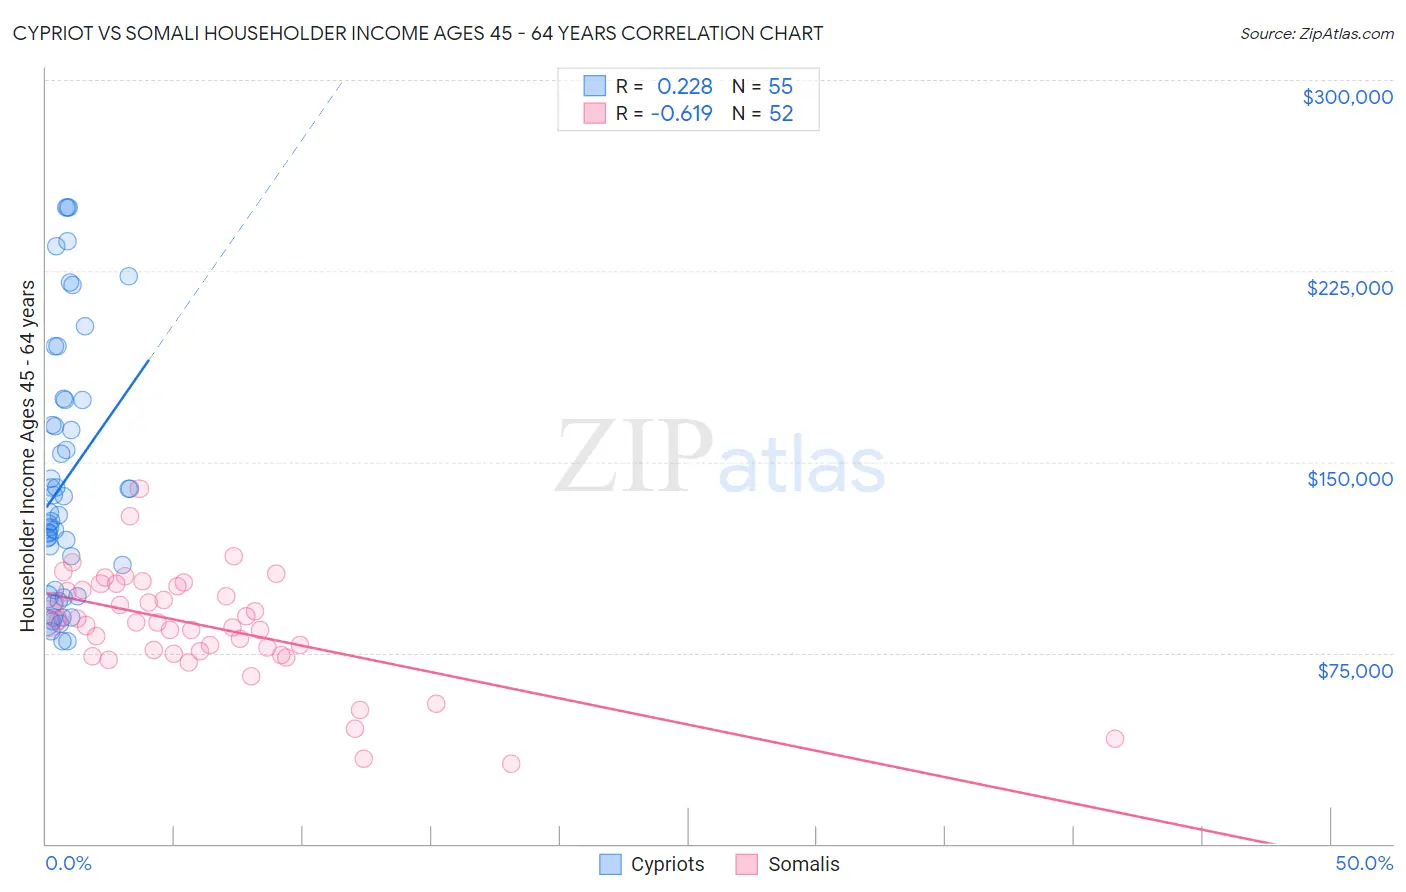
Cypriot vs Somali Householder Income Ages 45 - 64 years Correlation Chart
The statistical analysis conducted on geographies consisting of 61,824,510 people shows a weak positive correlation between the proportion of Cypriots and household income with householder between the ages 45 and 64 in the United States with a correlation coefficient (R) of 0.228 and weighted average of $123,396. Similarly, the statistical analysis conducted on geographies consisting of 99,239,152 people shows a significant negative correlation between the proportion of Somalis and household income with householder between the ages 45 and 64 in the United States with a correlation coefficient (R) of -0.619 and weighted average of $88,600, a difference of 39.3%.
Householder Income Ages 45 - 64 years Correlation Summary
| Measurement | Cypriot | Somali |
| Minimum | $79,338 | $31,458 |
| Maximum | $250,001 | $139,513 |
| Range | $170,663 | $108,055 |
| Mean | $142,303 | $85,624 |
| Median | $128,945 | $86,901 |
| Interquartile 25% (IQ1) | $97,356 | $75,206 |
| Interquartile 75% (IQ3) | $174,242 | $100,414 |
| Interquartile Range (IQR) | $76,886 | $25,208 |
| Standard Deviation (Sample) | $49,631 | $21,267 |
| Standard Deviation (Population) | $49,178 | $21,061 |
Similar Demographics by Householder Income Ages 45 - 64 years
Demographics Similar to Cypriots by Householder Income Ages 45 - 64 years
In terms of householder income ages 45 - 64 years, the demographic groups most similar to Cypriots are Immigrants from Israel ($122,893, a difference of 0.41%), Immigrants from Ireland ($122,757, a difference of 0.52%), Immigrants from South Central Asia ($124,188, a difference of 0.64%), Indian (Asian) ($122,343, a difference of 0.86%), and Immigrants from Eastern Asia ($122,222, a difference of 0.96%).
| Demographics | Rating | Rank | Householder Income Ages 45 - 64 years |
| Thais | 100.0 /100 | #4 | Exceptional $129,560 |
| Immigrants | Singapore | 100.0 /100 | #5 | Exceptional $129,514 |
| Iranians | 100.0 /100 | #6 | Exceptional $129,350 |
| Immigrants | Hong Kong | 100.0 /100 | #7 | Exceptional $127,500 |
| Immigrants | Iran | 100.0 /100 | #8 | Exceptional $126,940 |
| Okinawans | 100.0 /100 | #9 | Exceptional $124,796 |
| Immigrants | South Central Asia | 100.0 /100 | #10 | Exceptional $124,188 |
| Cypriots | 100.0 /100 | #11 | Exceptional $123,396 |
| Immigrants | Israel | 100.0 /100 | #12 | Exceptional $122,893 |
| Immigrants | Ireland | 100.0 /100 | #13 | Exceptional $122,757 |
| Indians (Asian) | 100.0 /100 | #14 | Exceptional $122,343 |
| Immigrants | Eastern Asia | 100.0 /100 | #15 | Exceptional $122,222 |
| Immigrants | China | 100.0 /100 | #16 | Exceptional $122,178 |
| Burmese | 100.0 /100 | #17 | Exceptional $121,444 |
| Immigrants | Korea | 100.0 /100 | #18 | Exceptional $121,243 |
Demographics Similar to Somalis by Householder Income Ages 45 - 64 years
In terms of householder income ages 45 - 64 years, the demographic groups most similar to Somalis are Belizean ($88,684, a difference of 0.090%), Immigrants from Senegal ($88,421, a difference of 0.20%), Osage ($88,390, a difference of 0.24%), Jamaican ($88,327, a difference of 0.31%), and Liberian ($88,929, a difference of 0.37%).
| Demographics | Rating | Rank | Householder Income Ages 45 - 64 years |
| West Indians | 0.5 /100 | #255 | Tragic $89,906 |
| French American Indians | 0.5 /100 | #256 | Tragic $89,811 |
| German Russians | 0.4 /100 | #257 | Tragic $89,398 |
| Immigrants | Barbados | 0.4 /100 | #258 | Tragic $89,394 |
| Immigrants | Nicaragua | 0.4 /100 | #259 | Tragic $89,108 |
| Liberians | 0.3 /100 | #260 | Tragic $88,929 |
| Belizeans | 0.3 /100 | #261 | Tragic $88,684 |
| Somalis | 0.3 /100 | #262 | Tragic $88,600 |
| Immigrants | Senegal | 0.3 /100 | #263 | Tragic $88,421 |
| Osage | 0.3 /100 | #264 | Tragic $88,390 |
| Jamaicans | 0.2 /100 | #265 | Tragic $88,327 |
| Immigrants | West Indies | 0.2 /100 | #266 | Tragic $88,164 |
| Hmong | 0.2 /100 | #267 | Tragic $88,115 |
| Immigrants | Micronesia | 0.2 /100 | #268 | Tragic $87,864 |
| Spanish Americans | 0.2 /100 | #269 | Tragic $87,836 |