Cypriot vs Australian Householder Income Ages 45 - 64 years
COMPARE
Cypriot
Australian
Householder Income Ages 45 - 64 years
Householder Income Ages 45 - 64 years Comparison
Cypriots
Australians
$123,396
HOUSEHOLDER INCOME AGES 45 - 64 YEARS
100.0/ 100
METRIC RATING
11th/ 347
METRIC RANK
$113,533
HOUSEHOLDER INCOME AGES 45 - 64 YEARS
99.9/ 100
METRIC RATING
47th/ 347
METRIC RANK
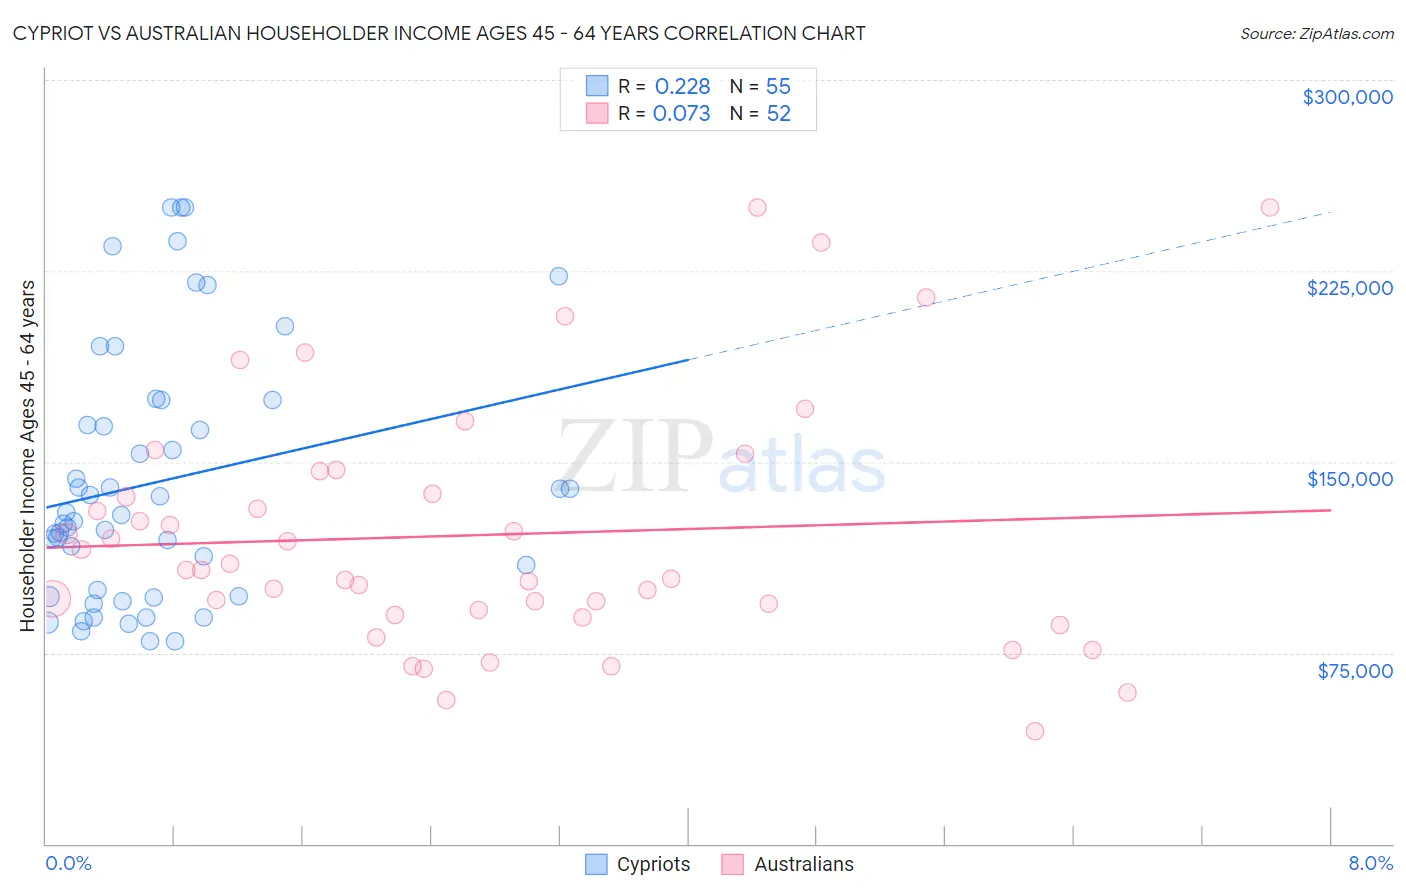
Cypriot vs Australian Householder Income Ages 45 - 64 years Correlation Chart
The statistical analysis conducted on geographies consisting of 61,824,510 people shows a weak positive correlation between the proportion of Cypriots and household income with householder between the ages 45 and 64 in the United States with a correlation coefficient (R) of 0.228 and weighted average of $123,396. Similarly, the statistical analysis conducted on geographies consisting of 223,862,786 people shows a slight positive correlation between the proportion of Australians and household income with householder between the ages 45 and 64 in the United States with a correlation coefficient (R) of 0.073 and weighted average of $113,533, a difference of 8.7%.
Householder Income Ages 45 - 64 years Correlation Summary
| Measurement | Cypriot | Australian |
| Minimum | $79,338 | $44,375 |
| Maximum | $250,001 | $250,001 |
| Range | $170,663 | $205,626 |
| Mean | $142,303 | $121,293 |
| Median | $128,945 | $107,375 |
| Interquartile 25% (IQ1) | $97,356 | $90,683 |
| Interquartile 75% (IQ3) | $174,242 | $141,845 |
| Interquartile Range (IQR) | $76,886 | $51,162 |
| Standard Deviation (Sample) | $49,631 | $48,820 |
| Standard Deviation (Population) | $49,178 | $48,348 |
Similar Demographics by Householder Income Ages 45 - 64 years
Demographics Similar to Cypriots by Householder Income Ages 45 - 64 years
In terms of householder income ages 45 - 64 years, the demographic groups most similar to Cypriots are Immigrants from Israel ($122,893, a difference of 0.41%), Immigrants from Ireland ($122,757, a difference of 0.52%), Immigrants from South Central Asia ($124,188, a difference of 0.64%), Indian (Asian) ($122,343, a difference of 0.86%), and Immigrants from Eastern Asia ($122,222, a difference of 0.96%).
| Demographics | Rating | Rank | Householder Income Ages 45 - 64 years |
| Thais | 100.0 /100 | #4 | Exceptional $129,560 |
| Immigrants | Singapore | 100.0 /100 | #5 | Exceptional $129,514 |
| Iranians | 100.0 /100 | #6 | Exceptional $129,350 |
| Immigrants | Hong Kong | 100.0 /100 | #7 | Exceptional $127,500 |
| Immigrants | Iran | 100.0 /100 | #8 | Exceptional $126,940 |
| Okinawans | 100.0 /100 | #9 | Exceptional $124,796 |
| Immigrants | South Central Asia | 100.0 /100 | #10 | Exceptional $124,188 |
| Cypriots | 100.0 /100 | #11 | Exceptional $123,396 |
| Immigrants | Israel | 100.0 /100 | #12 | Exceptional $122,893 |
| Immigrants | Ireland | 100.0 /100 | #13 | Exceptional $122,757 |
| Indians (Asian) | 100.0 /100 | #14 | Exceptional $122,343 |
| Immigrants | Eastern Asia | 100.0 /100 | #15 | Exceptional $122,222 |
| Immigrants | China | 100.0 /100 | #16 | Exceptional $122,178 |
| Burmese | 100.0 /100 | #17 | Exceptional $121,444 |
| Immigrants | Korea | 100.0 /100 | #18 | Exceptional $121,243 |
Demographics Similar to Australians by Householder Income Ages 45 - 64 years
In terms of householder income ages 45 - 64 years, the demographic groups most similar to Australians are Immigrants from Greece ($113,548, a difference of 0.010%), Immigrants from Indonesia ($113,519, a difference of 0.010%), Immigrants from France ($113,680, a difference of 0.13%), Immigrants from Russia ($113,215, a difference of 0.28%), and Bulgarian ($113,883, a difference of 0.31%).
| Demographics | Rating | Rank | Householder Income Ages 45 - 64 years |
| Cambodians | 99.9 /100 | #40 | Exceptional $114,342 |
| Immigrants | Lithuania | 99.9 /100 | #41 | Exceptional $114,336 |
| Estonians | 99.9 /100 | #42 | Exceptional $114,220 |
| Israelis | 99.9 /100 | #43 | Exceptional $114,186 |
| Bulgarians | 99.9 /100 | #44 | Exceptional $113,883 |
| Immigrants | France | 99.9 /100 | #45 | Exceptional $113,680 |
| Immigrants | Greece | 99.9 /100 | #46 | Exceptional $113,548 |
| Australians | 99.9 /100 | #47 | Exceptional $113,533 |
| Immigrants | Indonesia | 99.9 /100 | #48 | Exceptional $113,519 |
| Immigrants | Russia | 99.8 /100 | #49 | Exceptional $113,215 |
| Immigrants | Austria | 99.8 /100 | #50 | Exceptional $113,140 |
| Immigrants | South Africa | 99.8 /100 | #51 | Exceptional $112,886 |
| Immigrants | Malaysia | 99.8 /100 | #52 | Exceptional $112,796 |
| Afghans | 99.8 /100 | #53 | Exceptional $112,676 |
| Greeks | 99.8 /100 | #54 | Exceptional $112,630 |