Welsh vs Somali Householder Income Ages 45 - 64 years
COMPARE
Welsh
Somali
Householder Income Ages 45 - 64 years
Householder Income Ages 45 - 64 years Comparison
Welsh
Somalis
$100,322
HOUSEHOLDER INCOME AGES 45 - 64 YEARS
50.0/ 100
METRIC RATING
174th/ 347
METRIC RANK
$88,600
HOUSEHOLDER INCOME AGES 45 - 64 YEARS
0.3/ 100
METRIC RATING
262nd/ 347
METRIC RANK
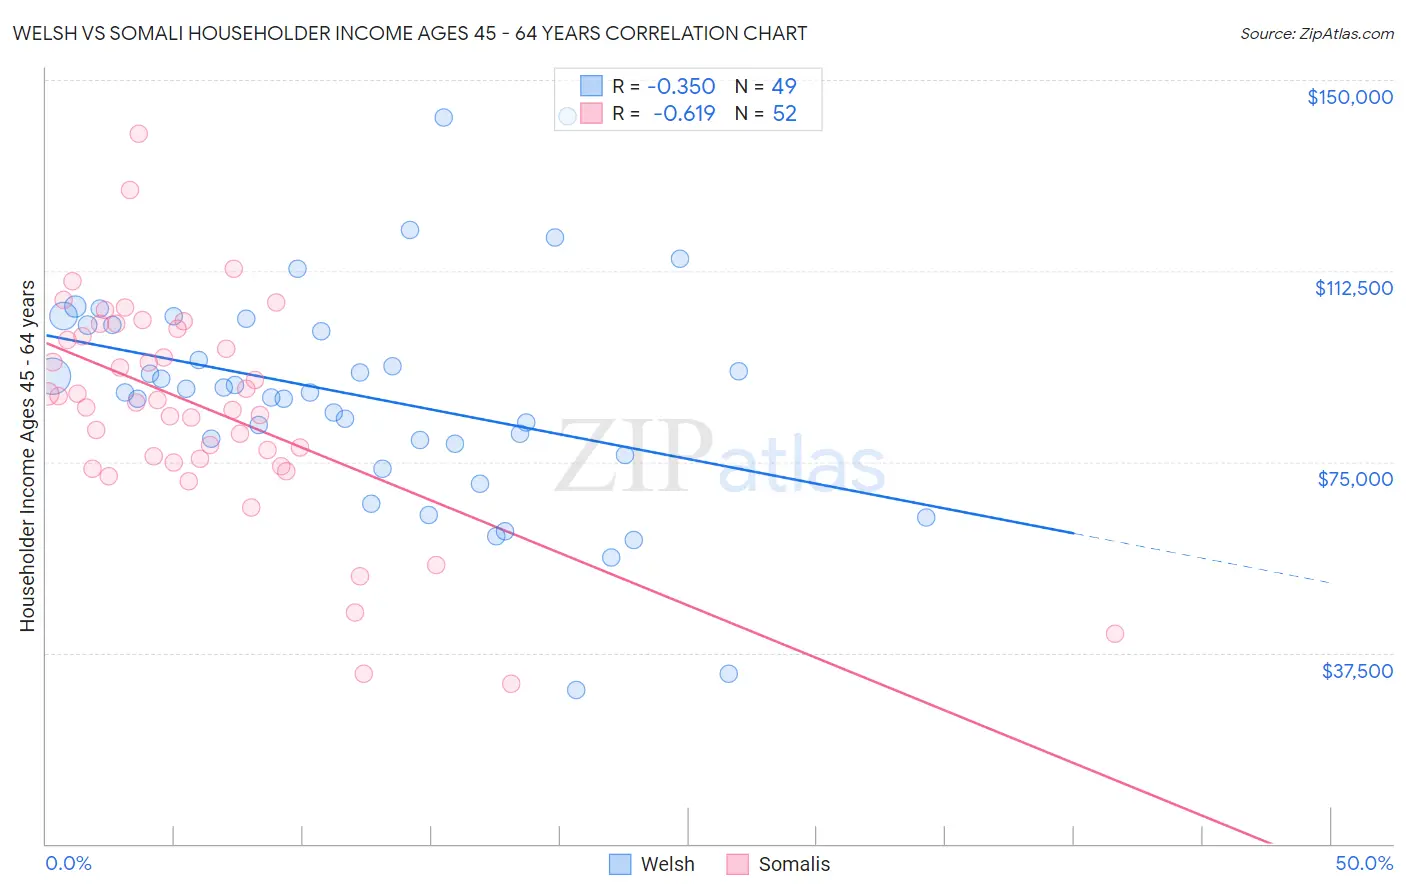
Welsh vs Somali Householder Income Ages 45 - 64 years Correlation Chart
The statistical analysis conducted on geographies consisting of 526,360,358 people shows a mild negative correlation between the proportion of Welsh and household income with householder between the ages 45 and 64 in the United States with a correlation coefficient (R) of -0.350 and weighted average of $100,322. Similarly, the statistical analysis conducted on geographies consisting of 99,239,152 people shows a significant negative correlation between the proportion of Somalis and household income with householder between the ages 45 and 64 in the United States with a correlation coefficient (R) of -0.619 and weighted average of $88,600, a difference of 13.2%.
Householder Income Ages 45 - 64 years Correlation Summary
| Measurement | Welsh | Somali |
| Minimum | $30,217 | $31,458 |
| Maximum | $142,813 | $139,513 |
| Range | $112,596 | $108,055 |
| Mean | $87,855 | $85,624 |
| Median | $88,674 | $86,901 |
| Interquartile 25% (IQ1) | $77,359 | $75,206 |
| Interquartile 75% (IQ3) | $101,863 | $100,414 |
| Interquartile Range (IQR) | $24,505 | $25,208 |
| Standard Deviation (Sample) | $22,164 | $21,267 |
| Standard Deviation (Population) | $21,937 | $21,061 |
Similar Demographics by Householder Income Ages 45 - 64 years
Demographics Similar to Welsh by Householder Income Ages 45 - 64 years
In terms of householder income ages 45 - 64 years, the demographic groups most similar to Welsh are German ($100,224, a difference of 0.10%), Alsatian ($100,435, a difference of 0.11%), Immigrants from Costa Rica ($100,141, a difference of 0.18%), Moroccan ($100,138, a difference of 0.18%), and Immigrants from Uzbekistan ($100,523, a difference of 0.20%).
| Demographics | Rating | Rank | Householder Income Ages 45 - 64 years |
| Czechoslovakians | 63.0 /100 | #167 | Good $101,387 |
| South American Indians | 60.5 /100 | #168 | Good $101,171 |
| Guamanians/Chamorros | 60.5 /100 | #169 | Good $101,170 |
| Slovaks | 58.8 /100 | #170 | Average $101,029 |
| South Americans | 56.4 /100 | #171 | Average $100,837 |
| Immigrants | Uzbekistan | 52.5 /100 | #172 | Average $100,523 |
| Alsatians | 51.4 /100 | #173 | Average $100,435 |
| Welsh | 50.0 /100 | #174 | Average $100,322 |
| Germans | 48.8 /100 | #175 | Average $100,224 |
| Immigrants | Costa Rica | 47.7 /100 | #176 | Average $100,141 |
| Moroccans | 47.7 /100 | #177 | Average $100,138 |
| Immigrants | Cameroon | 47.0 /100 | #178 | Average $100,084 |
| Belgians | 46.7 /100 | #179 | Average $100,060 |
| Aleuts | 46.6 /100 | #180 | Average $100,052 |
| Immigrants | Immigrants | 45.3 /100 | #181 | Average $99,943 |
Demographics Similar to Somalis by Householder Income Ages 45 - 64 years
In terms of householder income ages 45 - 64 years, the demographic groups most similar to Somalis are Belizean ($88,684, a difference of 0.090%), Immigrants from Senegal ($88,421, a difference of 0.20%), Osage ($88,390, a difference of 0.24%), Jamaican ($88,327, a difference of 0.31%), and Liberian ($88,929, a difference of 0.37%).
| Demographics | Rating | Rank | Householder Income Ages 45 - 64 years |
| West Indians | 0.5 /100 | #255 | Tragic $89,906 |
| French American Indians | 0.5 /100 | #256 | Tragic $89,811 |
| German Russians | 0.4 /100 | #257 | Tragic $89,398 |
| Immigrants | Barbados | 0.4 /100 | #258 | Tragic $89,394 |
| Immigrants | Nicaragua | 0.4 /100 | #259 | Tragic $89,108 |
| Liberians | 0.3 /100 | #260 | Tragic $88,929 |
| Belizeans | 0.3 /100 | #261 | Tragic $88,684 |
| Somalis | 0.3 /100 | #262 | Tragic $88,600 |
| Immigrants | Senegal | 0.3 /100 | #263 | Tragic $88,421 |
| Osage | 0.3 /100 | #264 | Tragic $88,390 |
| Jamaicans | 0.2 /100 | #265 | Tragic $88,327 |
| Immigrants | West Indies | 0.2 /100 | #266 | Tragic $88,164 |
| Hmong | 0.2 /100 | #267 | Tragic $88,115 |
| Immigrants | Micronesia | 0.2 /100 | #268 | Tragic $87,864 |
| Spanish Americans | 0.2 /100 | #269 | Tragic $87,836 |