Ethiopian vs Somali Householder Income Ages 45 - 64 years
COMPARE
Ethiopian
Somali
Householder Income Ages 45 - 64 years
Householder Income Ages 45 - 64 years Comparison
Ethiopians
Somalis
$103,736
HOUSEHOLDER INCOME AGES 45 - 64 YEARS
84.7/ 100
METRIC RATING
138th/ 347
METRIC RANK
$88,600
HOUSEHOLDER INCOME AGES 45 - 64 YEARS
0.3/ 100
METRIC RATING
262nd/ 347
METRIC RANK
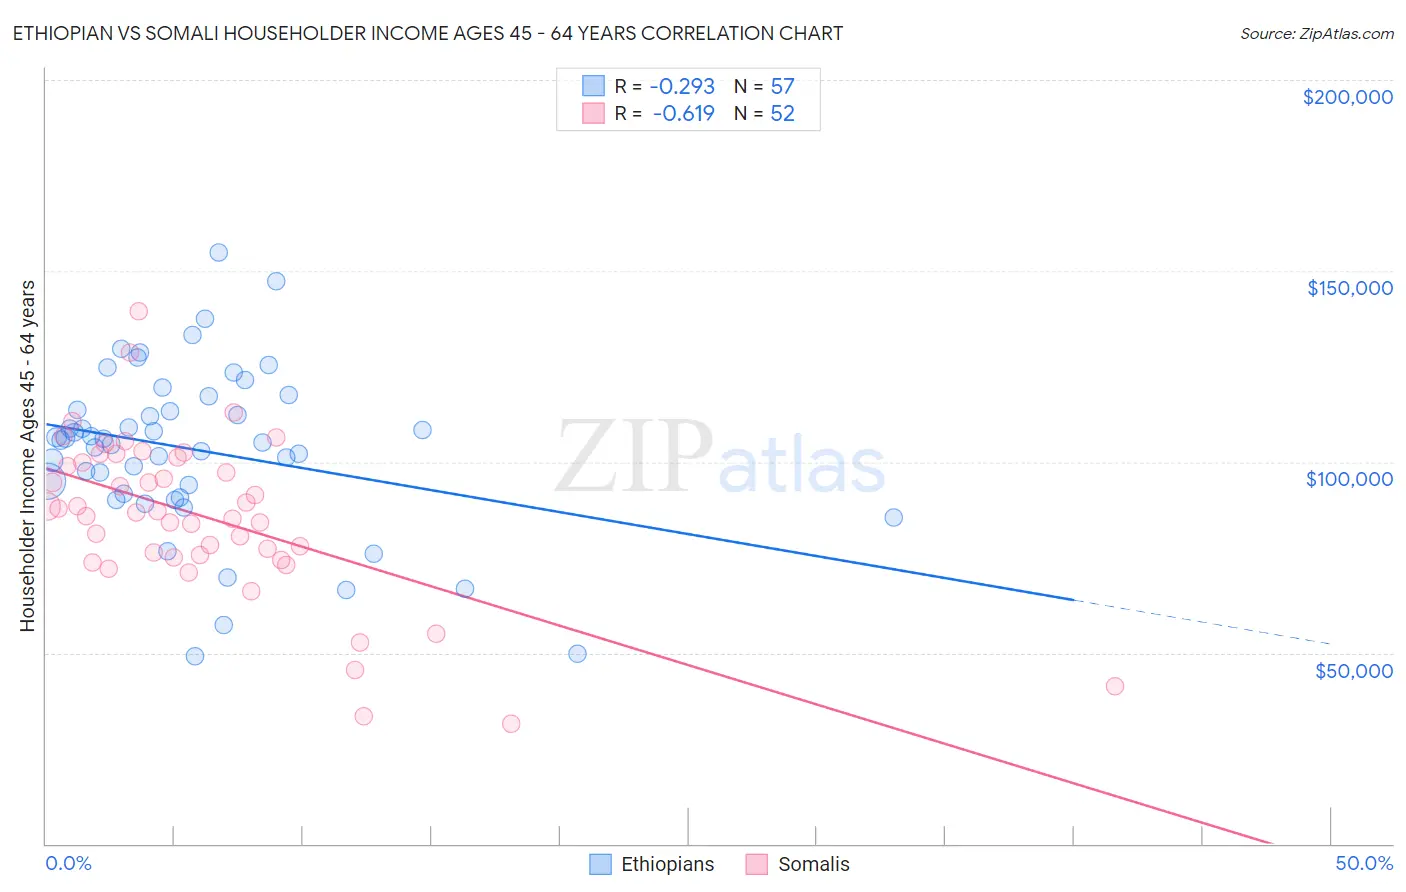
Ethiopian vs Somali Householder Income Ages 45 - 64 years Correlation Chart
The statistical analysis conducted on geographies consisting of 222,913,789 people shows a weak negative correlation between the proportion of Ethiopians and household income with householder between the ages 45 and 64 in the United States with a correlation coefficient (R) of -0.293 and weighted average of $103,736. Similarly, the statistical analysis conducted on geographies consisting of 99,239,152 people shows a significant negative correlation between the proportion of Somalis and household income with householder between the ages 45 and 64 in the United States with a correlation coefficient (R) of -0.619 and weighted average of $88,600, a difference of 17.1%.
Householder Income Ages 45 - 64 years Correlation Summary
| Measurement | Ethiopian | Somali |
| Minimum | $48,981 | $31,458 |
| Maximum | $154,904 | $139,513 |
| Range | $105,923 | $108,055 |
| Mean | $103,166 | $85,624 |
| Median | $105,724 | $86,901 |
| Interquartile 25% (IQ1) | $91,126 | $75,206 |
| Interquartile 75% (IQ3) | $115,330 | $100,414 |
| Interquartile Range (IQR) | $24,204 | $25,208 |
| Standard Deviation (Sample) | $21,688 | $21,267 |
| Standard Deviation (Population) | $21,497 | $21,061 |
Similar Demographics by Householder Income Ages 45 - 64 years
Demographics Similar to Ethiopians by Householder Income Ages 45 - 64 years
In terms of householder income ages 45 - 64 years, the demographic groups most similar to Ethiopians are Immigrants from Oceania ($103,705, a difference of 0.030%), Norwegian ($103,682, a difference of 0.050%), Immigrants from Uganda ($103,584, a difference of 0.15%), Hungarian ($103,913, a difference of 0.17%), and Luxembourger ($103,536, a difference of 0.19%).
| Demographics | Rating | Rank | Householder Income Ages 45 - 64 years |
| Immigrants | Syria | 90.7 /100 | #131 | Exceptional $104,858 |
| Lebanese | 90.1 /100 | #132 | Exceptional $104,734 |
| Arabs | 89.3 /100 | #133 | Excellent $104,566 |
| Canadians | 89.3 /100 | #134 | Excellent $104,560 |
| Brazilians | 88.6 /100 | #135 | Excellent $104,408 |
| Taiwanese | 87.4 /100 | #136 | Excellent $104,180 |
| Hungarians | 85.8 /100 | #137 | Excellent $103,913 |
| Ethiopians | 84.7 /100 | #138 | Excellent $103,736 |
| Immigrants | Oceania | 84.5 /100 | #139 | Excellent $103,705 |
| Norwegians | 84.3 /100 | #140 | Excellent $103,682 |
| Immigrants | Uganda | 83.7 /100 | #141 | Excellent $103,584 |
| Luxembourgers | 83.3 /100 | #142 | Excellent $103,536 |
| Serbians | 83.2 /100 | #143 | Excellent $103,522 |
| Czechs | 83.1 /100 | #144 | Excellent $103,507 |
| Ugandans | 82.9 /100 | #145 | Excellent $103,472 |
Demographics Similar to Somalis by Householder Income Ages 45 - 64 years
In terms of householder income ages 45 - 64 years, the demographic groups most similar to Somalis are Belizean ($88,684, a difference of 0.090%), Immigrants from Senegal ($88,421, a difference of 0.20%), Osage ($88,390, a difference of 0.24%), Jamaican ($88,327, a difference of 0.31%), and Liberian ($88,929, a difference of 0.37%).
| Demographics | Rating | Rank | Householder Income Ages 45 - 64 years |
| West Indians | 0.5 /100 | #255 | Tragic $89,906 |
| French American Indians | 0.5 /100 | #256 | Tragic $89,811 |
| German Russians | 0.4 /100 | #257 | Tragic $89,398 |
| Immigrants | Barbados | 0.4 /100 | #258 | Tragic $89,394 |
| Immigrants | Nicaragua | 0.4 /100 | #259 | Tragic $89,108 |
| Liberians | 0.3 /100 | #260 | Tragic $88,929 |
| Belizeans | 0.3 /100 | #261 | Tragic $88,684 |
| Somalis | 0.3 /100 | #262 | Tragic $88,600 |
| Immigrants | Senegal | 0.3 /100 | #263 | Tragic $88,421 |
| Osage | 0.3 /100 | #264 | Tragic $88,390 |
| Jamaicans | 0.2 /100 | #265 | Tragic $88,327 |
| Immigrants | West Indies | 0.2 /100 | #266 | Tragic $88,164 |
| Hmong | 0.2 /100 | #267 | Tragic $88,115 |
| Immigrants | Micronesia | 0.2 /100 | #268 | Tragic $87,864 |
| Spanish Americans | 0.2 /100 | #269 | Tragic $87,836 |